- 投稿日:2019-08-30T23:56:42+09:00
█║▌Software Defined to Spatial Defined Networking
While software defined networking has proven its value, SynchroKnot has taken software defined networking to a whole new dimension with Spatial Defined Networking.
Spatial Defined Networking is made up of SynchroKnot's core networking component called Satellite Tree Protocol, which is an enhancement to the IEEE standard [ 802.1D (1998|2004), 802.1W ] while keeping the core semantics in place.
This simplistically means, you can use any commodity X86_64 Desktop/Workstation/Server/Embedded device and connect them to eachother.
There is no need to purchase physical or virtual switches and routers or any of their licenses [Eg. Cisco, Juniper etc].
Satellite Tree Protocol is the core networking component of the SynchroKnot Cloud Computing and Data Center Decentralization software.
In brief, the SynchroKnot software transforms any server, workstation, desktop or embedded device into a decentralized cloud or data center [data decenter].
There are various demonstration videos depicting its workability, performance, security and scalability on synchroknot.tokyo
Here are some of the highlights of the SynchroKnot Satellite Tree Protocol:
■ Automatic - Mission-Critical - Resilient - Self-Sustaining - Self-Healing - Seamless Scaling Without Down-Time - High-Performance.
■ Nothing to configure or manage.
■ Enhancement to the IEEE standard [ 802.1D (1998|2004), 802.1W ] while keeping the core semantics in place.
Standard Layer 2 Ethernet remains pure, untouched and unmodified without frame encapsulation, additional headers or other forms of tinkering.
■ Improving upon and applying the globally accepted IEEE standard found in network switches onto Spatial Fabric Satellites. Network is no longer a separate complex component with separate hardware and licenses, but is now built right in with nothing extra that needs to be done.
■ Depending on your need and/or requirement, you now have a logical straight-forward option and ability to eliminate Top-of-the-Rack, Spine, Leaf, Edge, Aggregation and Core Switches & Routers, along with their respective licenses.
■ Large-Scale, High-Performance Layer 2 Environment with a single instance of Satellite Tree Protocol with support for single, double and triple stacked VLANS.
■ Does not cause a network-wide outage on failure of link(s) as experienced with regular Spanning Tree Protocol [ STP ] and Rapid Spanning Tree Protocol [ RSTP ].
■ Recovery from failure is, in most cases, in sub-milliseconds to about 1.5 seconds depending on the nature of failure [ single / multiple links ] and the distance from the point(s) of failure. Traffic that does not traverse the path where failure occured is generally not affected by the failure at all.
■ Intelligent Layer 2 Optimized Cost Multipath forwarding logic based on local intelligence chooses the best link with the shortest optimal path in normal operation, congestion and on link failure.
■ Multiple ANY-to-ANY Layer 2 routes allow you to add and remove hardware transparently without turning off whole or sections of the network, as experienced with switches and routers in networks today.
■ Zero Configuration.
How about never having to endure countless hours of pain configuring, managing and maintaining physical Ethernet ports, trunking and ACLs and other aspects? How about plugging one end of Ethernet cable into ANY physical port of a commodity hardware and connecting the other end to ANY physical port of another commodity hardware and that's it - nothing to do.
■ Get the best of cost, low latency, bandwidth and performance in multiple directions, not just East-West / North-South with the help of SynchroKnot Multi-Dimensional topology.
■ SynchroKnot Multi-Dimensional topology is a dynamic mix and integration of proven network topologies which are used as a primary backbone in High Performance Computing and Supercomputing. These include Ring, 2-D, 3-D and many other custom topologies optimized for cost, performance and simplified cabling.
■ Single-length cable for the entire cluster. No long haul cables. No expensive power-consuming optical cables.
■ Very low CPU usage.
Apart from all these features, there are multitude of extra security features to choose from on top of the Satellite Tree Protocol.
More information is available at:
■ synchroknot.tokyo
■ synchroknot.orgYou are encouraged to share your knowledge with others!

- 投稿日:2019-08-30T23:17:42+09:00
Pythonで自己相関グラフ(コレログラム)を描く
※ この記事のコードはJupyter Notebook上での実行を想定しています。
※ この記事のJupyter Notebook版はこちら。Pythonで自己相関グラフ(コレログラム)を描く
時系列分析で目にする自己相関グラフですが、Pythonを用いてこれを描く方法がいくつかあります。
ここでは、
- 関数を自作して自己相関を求め、Matplotlibのpyplot.stemを使う方法
- Statsmodelsのplot_acfを使う方法
- Pandasのautocorrelation_plotを使う方法
- Matplotlibのpyplot.acorrを使う方法
を紹介します。
グラフで使うデータを作る
まずはじめにnumpyを使って時系列データを作ります。
わかりやすいデータにしておきたいので、1から10を3回繰り返す1次元arrayを作ります。
import numpy as np
a = np.arange(1,11)
b = np.tile(a, 3)
bの中身は、array([ 1, 2, 3, 4, 5, 6, 7, 8, 9, 10, 1, 2, 3, 4, 5, 6, 7, 8, 9, 10, 1, 2, 3, 4, 5, 6, 7, 8, 9, 10])となっています。
Matplotlibのpyplot.stemを使う方法
ラグが$k$のデータとの自己相関$r_k$は以下の式で求められます。
$$r_{k} = \frac{\sum\limits_{t=k+1}^T (y_{t}-\bar{y})(y_{t-k}-\bar{y})}
{\sum\limits_{t=1}^T (y_{t}-\bar{y})^2}$$ここで$T$は含まれる時系列データの数を、$\bar{y}$は時系列データ全体の平均を表しています。
まずはじめにラグが$k$のデータとの自己相関を求める
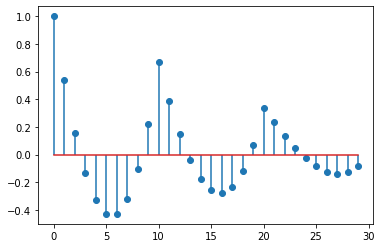
autocorrelation関数を作ります。def autocorrelation(data, k): """Returns the autocorrelation of the *k*th lag in a time series data. Parameters ---------- data : one dimentional numpy array k : the *k*th lag in the time series data (index starts at 0) """ # yの平均 y_avg = np.mean(data) # 分子の計算 sum_of_covariance = 0 for i in range(k+1, 30): covariance = ( data[i] - y_avg ) * ( data[i-(k+1)] - y_avg ) sum_of_covariance += covariance # 分母の計算 sum_of_denominator = 0 for u in range(30): denominator = ( data[u] - y_avg )**2 sum_of_denominator += denominator return sum_of_covariance / sum_of_denominatorこれでラグが$k$のデータとの自己相関を出力することができるようになりました。
ひとつ注意しなければいけないのは、numpyのarrayは多くのデータと同様に0から数え始めるので、ここでは$k$の値が先程の式より1つ小さくなります。
4番目のラグ、9番目のラグとの自己相関を求めてみます。
autocorrelation(b, 4)
# 返り値: -0.4292929292929293

autocorrelation(b, 9)
# 返り値: 0.6666666666666666
次に自己相関のグラフ化に移ります。
グラフ化するにはそれぞれの自己相関が必要なので、
acorr_dataというリストに先程の関数を使って全ての自己相関を入れていきます。このときに、グラフ上ではラグのない自身との相関を1として表示させたいので
acorr_dataに「1」を最初に入れておきます。acorr_data = [1] for i in range(29): # ラグをとったデータは29個あるのでrange(29)となります。 acorr_data.append(autocorrelation(b, i))後で使いやすいように
acorr_dataをnumpyのarrayに変換しておきます。acorr_data = np.asarray(acorr_data)
acorr_dataの中身はarray([ 1. , 0.53636364, 0.15757576, -0.13232323, -0.32929293, -0.42929293, -0.42828283, -0.32222222, -0.10707071, 0.22121212, 0.66666667, 0.38484848, 0.14747475, -0.04141414, -0.17777778, -0.25757576, -0.27676768, -0.23131313, -0.11717172, 0.06969697, 0.33333333, 0.23333333, 0.13737374, 0.04949495, -0.02626263, -0.08585859, -0.12525253, -0.14040404, -0.12727273, -0.08181818])となっています。
次にMatplotlibを使ってこれをグラフ化します。
ここではMatplotlibのStem Plotと呼ばれるグラフを使います。
%matplotlib inline
import matplotlib.pyplot as plt
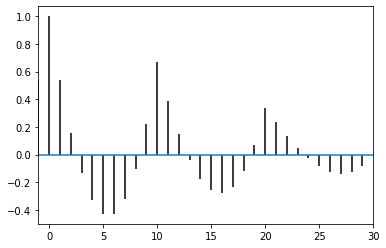
plt.stem(np.arange(30), acorr_data, use_line_collection=True)
この
plt.stemのuse_line_collectionというパラメータは棒の部分の表示の高速化のためのもので、必須ではありません。このグラフでは、$r_0=1$としているので、横軸の$k$の値は最初の式と一致します。
Statsmodelsのplot_acfを使う方法
上の例では自己相関を求める関数を自作して
bの自己相関を求め、それらの値を用いてStem Plotを使ってグラフを描きました。Statsmodelsの
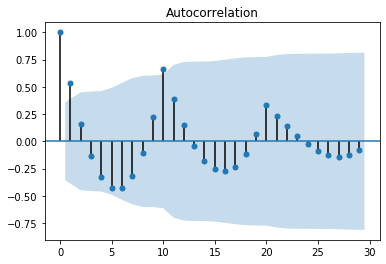
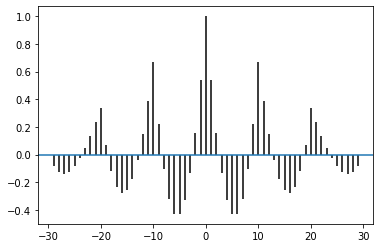
plot_acf(リンク)を使うことでこれらを一度に行うことができます。import statsmodels.graphics.api as smg from statsmodels.graphics.tsaplots import plot_acf plot_acf(b, lags=29); # 最後のセミコロンは、statsmodelが2つの同じグラフを描くのを防ぐために書いています。 # 参考リンク: https://github.com/statsmodels/statsmodels/issues/1265#issuecomment-383336489 # plt.show() という行を付け加えることで防ぐこともできます。 # 参考リンク: https://momonoki2017.blogspot.com/2018/03/python7.htmlグラフに表示されている薄い青の帯はBartlett’s formulaを用いた95%信頼区間です。
alphaのパラメータを指定することで信頼区間の幅を変えることができます。Pandasのautocorrelation_plotを使う方法
Statsmodelsの
plot_acfと同様に、Pandasのautocorrelation_plot(リンク)を使うことで自己相関グラフを描くことができます。Pandasではnumpyの1次元arrayをPandasのSeriesに変換する必要があります。
import pandas as pd
from pandas.plotting import autocorrelation_plot
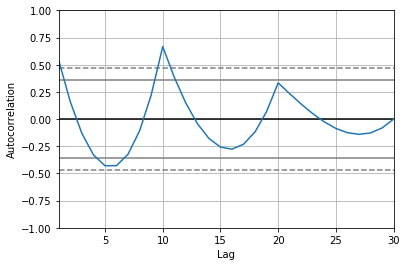
autocorrelation_plot(pd.Series(b))
グラフの点線に挟まれている範囲は99%の信頼区間、実線に挟まれている範囲は95%の信頼区間を表しています。
Matplotlibのpyplot.acorrを使う方法
Matplotlibの
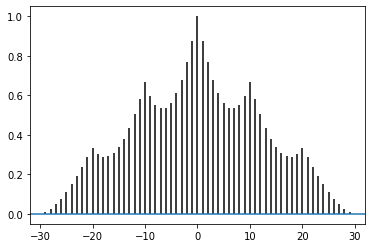
pyplot.acorr(リンク)を使うことで、StatsmodelsやPandasと同様にデータから直接グラフを描くことができます。# plt.acorr(b, maxlags=None) # 上記コードで実行するとエラーになります。 # データをfloatに変えることでエラーを回避することができます。 plt.acorr(b.astype('f'), maxlags=None)見てわかる通り、今までのグラフとは形が違います。
これは
pyplot.acorrが信号処理を念頭においた関数だからとのことです。
bのデータからbの平均を引いたものを引数として与えることで先程までのグラフと縦軸の値を統一することができます。plt.acorr(b.astype('f')-b.mean(), maxlags=None)Axesの
set_xlim(リンク)を使うことで表示させるx軸の範囲を指定することができます。fig, ax = plt.subplots() ax.set_xlim(-1, 30) plt.acorr(b.astype('f')-b.mean(), maxlags=None)参考資料
- Rob J Hyndman and George Athanasopoulos, Forecasting: Principles and Practice: 2.8 Autocorrelation
- もものきとデータ解析をはじめよう: Pythonで時系列分析の練習(7)自己相関
- Stack Overflow: bug of autocorrelation plot in matplotlib‘s plt.acorr?
- James H. Stock, Mark W. Watson, Introduction to Econometrics, 3rd Edition, Pearson, 2011, p. 572-575
- Christoph Hanck, Martin Arnold, Alexander Gerber and Martin Schmelzer, Introduction to Econometrics with R: 14.2 Time Series Data and Serial Correlation
備考
この記事はクリエイティブ・コモンズ 表示 4.0 国際 ライセンスの下に提供されています。
- 投稿日:2019-08-30T22:23:17+09:00
Cloud Computing Decentralization Software
We have heard of Cloud Computing, Data Centers, Edge computing and their numerous expansions and variations. However for the most part the architectures used underneath these infrastructures and the technologies governing them remain centralized in terms of location and disparate in terms of hardware + software used at that central location.
For example, you may have your cloud computing infrastructure located at a centralized data center. This cloud computing infrastructure is made of up disparate hardware, namely servers, redundant switches & routers, storage [SAN/NAS] and load balancers etc., and run the standard virtualization software like OpenStack, VMware, Hyper-V and so on.
So, in a sense, this standard and expensive business model has locked itself into a myriad of traps. Some of the most important traps are scalability, complexity, security, manageability, maintenance, vendor lock-ins, maintaining of multi-tiered separate teams, time-consuming fixes to problems, and much more.
One method out of this architectural quicksand is to look at the novel approach of the wonderful research done within the Blockchain and IoT industry and adapt it to the systems architecture in a way such that you should be able to use all kinds of systems from embedded devices to desktops, workstations and servers across both wired and wireless networks transparently.
In other words, building a decentralized, automatic cloud and data center which can be rapidly scaled globally within the budget and performance requirements of the end users. Plus, it must have the ability to be kept at locations other than just a data center. Some of the examples of locations are offices, cubicles, basements, apartments, closets, fiber optic hubs, 5G base stations, shops and much more.
This is where SynchroKnot software does it all and takes care of everything. SynchroKnot has made it easy with its software. It installs in minutes and does much more than what the centralized cloud computing and data center technologies put together can do today and what they aspire to be able to do in the future.
You can transform any server, workstation, desktop or embedded device into a decentralized cloud or data center and connect them to eachother in minutes!
Apart from just merely de-centralizing, with SynchroKnot, anyone can sell their full or under-utilized hardware resources using Bitcoin, and without involving centralized financial institutions/payment processors.
SynchroKnot also has multifarious real-world security measures built into the software, which are aimed at substantially improving the overall security of decentralized systems.
█║▌║▌║ Data Center & Cloud Computing Today - VS - SynchroKnot ║█
█║ Data Center & Cloud Computing Today
│
├──> Must Purchase Disparate Hardware - servers, redundant switches & routers, storage [SAN/NAS] and load balancers.
├──> Must Purchase Virtualization Software + Licenses - VMware, OpenStack, Hyper-V, RHEV, Xen, VDI etc.
├──> Must Purchase Storage Software + Licenses.
├──> Must Purchase Licenses for Switches, Routers & Load Balancers [above and beyond the hardware].
├──> Must Manage Separate Hardware & Software Through Different Management Panels, User Interfaces and APIs.
├──> Must Maintain Separate Multi-Tiered Teams and Departments To Manage Complex Operations.
└──> Must Have A Large Space To House Expensive Hardware With High-Cost Real Estate & Cooling.
█║ SynchroKnot Advantage: Decentralized Data Center and Cloud Computing
│
├──> SynchroKnot Software Does Everything.
├──> No Separate Hardware Needed - Use Any Commodity X86_64 Desktop/Workstation/Server/Embedded Device and Connect Them To Eachother.
├──> No Need To Purchase Separate Desktop & Server Virtualization Software OR Their Licenses [Eg. VMware, OpenStack, Hyper-V, RHEV, Xen, VDI etc].
├──> No Need To Purchase Physical OR Virtual Switches and Routers OR Any Of Their Licenses [Eg. Cisco, Juniper etc].
├──> No Need To Purchase SAN/NAS/Distributed Block & File Storage [Eg. Netapp, EMC, Gluster, Ceph etc].
├──> No Separate Teams And Departments Needed.
├──> No Large Space Needed. SynchroKnot Setup Is Very Flexible. You Can Utilize Cubicles, Offices, Apartments, Basements, Fibre Optic Hubs etc.
├──> Transparently Scale and De-Scale [locally/globally] Your SynchroKnot Infrastructure On-Demand Without Disruption/Interruption.
└──> Be Your Own Cloud Provider. Sell Full or Under-Utilized Hardware Resources With Bitcoin Internally/Externally [New Feature Coming Soon].
█║ SynchroKnot: Economic Advantages
│
├──> Exponential Reduction In Total Cost.
├──> Exponential Reduction In Complexity.
├──> Exponential Reduction In Manpower.
├──> Exponential Increase In Performance.
├──> Exponential Increase In Security.
├──> Exponential Increase In Scalability & Over-all Control & Responsiveness.
├──> Eliminate All Vendor and Multi-Vendor Lock-ins, Interdependencies & Traps.
├──> Comprises 10+ Year Production Seasoned Open-Source Components.
└──> Significantly Increase Your Organization's Micro and Macro Economic Dynamics and Manpower Efficiency.
More information is available at:
synchroknot.tokyo
synchroknot.org
Feel free to get in touch and share your knowledge with others!
SynchroKnot Architecture : Depictions :
- 投稿日:2019-08-30T20:39:37+09:00
ディープラーニングでサンドウィッチマンのコントを作る(ver.3)
サンドウィッチマンのコントをディープラーニングで作る第3弾!!!!!!!!!!!!
pytorchで実装してます
- Ver1 >> https://qiita.com/yoyoyo_/items/105879c386be1d8b0782
- Ver2 >> https://qiita.com/yoyoyo_/items/f30c538234e62dbaa081
サンドウィッチマンのコントは数も限られているので、どこまでモデル改良とチューニングと工夫があるかでやってます
GRUとSeq2seqでやってます。
こんかいからナイーブなSeq2seqでなく、AttentionにさらにTransformerのテクニックを組み込んで、学習方法も工夫してます。
Transformerにしていくために見た参考サイトはこれ 作って理解する Transformer / Attention
Done1. Attentionメカニズムの変更
pytorchのseq2seqページを見ると、なんかAttentionが違う感じもしたので、自分で組み直した
Attentionのコードはこれ
Attentionの仕組みは 作って理解する Transformer / Attention がよかった
class Attention(torch.nn.Module):
    def __init__(self, output_size, dropout_p=0.1, max_length=MAX_LENGTH):
        super(Attention, self).__init__()
        self.output_size = output_size
        self.dropout_p = dropout_p
        self.max_length = max_length

        # input one-hot -> dense vector
        self.input_embedding = torch.nn.Embedding(self.output_size, hidden_dim)
        self.input_embedding_dropout = torch.nn.Dropout(dropout_p)

        # Attention Query
        #self.Q_embedding = torch.nn.Embedding(self.output_size, hidden_dim)
        #self.Q_dropout = torch.nn.Dropout(self.dropout_p)
        self.Q_dense = torch.nn.Linear(hidden_dim, hidden_dim)
        self.Q_dense_dropout = torch.nn.Dropout(dropout_p)
        #self.Q_BN = torch.nn.BatchNorm1d(hidden_dim)

        # Attention Key
        self.K_dense = torch.nn.Linear(RNN_dim, hidden_dim)
        self.K_dense_dropout = torch.nn.Dropout(dropout_p)
        #self.K_BN = torch.nn.BatchNorm1d(hidden_dim)

        # Attetion Value
        self.V_dense = torch.nn.Linear(RNN_dim, hidden_dim)
        self.V_dense_dropout = torch.nn.Dropout(dropout_p)
        #self.V_BN = torch.nn.BatchNorm1d(hidden_dim)

        # Attention mask
        #self.attention = torch.nn.Linear(hidden_dim * 2, self.max_length)
        self.attention_dense = torch.nn.Linear(hidden_dim * 2, hidden_dim)
        self.attention_dropout = torch.nn.Dropout(dropout_p)
        #self.attention_BN = torch.nn.BatchNorm1d(hidden_dim)

    def forward(self, _input, memory):
        # input embedding : onehot -> dense vector
        _input_vector = self.input_embedding(_input)

        # get Query
        Q = self.Q_dense(_input_vector.view(1, -1))
        #Q = self.Q_BN(Q)
        Q = self.Q_dense_dropout(Q)
        Q = Q.view(1, 1, -1)

        # Transformer technique 1 : scaled dot product
        Q *= Q.size()[-1] ** -0.5

        # get Key
        K = self.K_dense(memory)
        #K = self.K_BN(K)
        K = self.K_dense_dropout(K)
        K = K.view(1, self.max_length, -1)
        K = K.permute([0, 2, 1])

        # get Query and Key (= attention logits)
        QK = torch.bmm(Q, K)
        # Transformer technique 2 : masking attention weight
        any_zero = memory.sum(dim=1)
        pad_mask = torch.ones([1, 1, self.max_length]).to(device)
        pad_mask[:, :, torch.nonzero(any_zero)] = 0
        QK += pad_mask * sys.float_info.min

        # get attention weight
        attention_weights = F.softmax(QK, dim=-1)

        # get Value
        V = self.V_dense(memory)
        #V = self.V_BN(V)
        V = self.V_dense_dropout(V)
        V = V.view(1, self.max_length, -1)

        # Attetion x Value
        attention_feature = torch.bmm(attention_weights, V)

        # attention + Input
        attention_x = torch.cat([_input_vector, attention_feature], dim=-1)

        # apply attention dense
        attention_output = self.attention_dense(attention_x)
        #attention_output = self.attention_BN(attention_output)
        attention_output = F.relu(attention_output)
        attention_output = self.attention_dropout(attention_output)

        return attention_output
Attentionを組み込んでDecoderをこう作った
class Decoder(torch.nn.Module):
    def __init__(self, hidden_dim, output_size, dropout_p=0.1, max_length=MAX_LENGTH, multihead=False):
        super(Decoder, self).__init__()
        self.hidden_dim = hidden_dim
        self.output_size = output_size
        self.dropout_p = dropout_p
        self.max_length = max_length

        # Attention
        if multihead:
            self.attention = MultiHead_Attention(hidden_dim=hidden_dim, output_size=output_size, dropout_p=dropout_p, max_length=max_length, head_N=4)
        else:
            self.attention = Attention(output_size=output_size, dropout_p=dropout_p, max_length=max_length)

        # Decoder
        self.gru = torch.nn.GRU(hidden_dim, hidden_dim, num_layers=num_layers, bidirectional=Bidirectional)
        self.out = torch.nn.Linear(RNN_dim, output_size)


    def forward(self, x, hidden, memory):
        x = self.attention(x, memory)
        x, hidden = self.gru(x, hidden)
        x = self.out(x[0])
        x = F.softmax(x, dim=-1)
        return x, hidden, None
Done2. Multi head Attetion
これも 作って理解する Transformer / Attention がよかった
実装はこんな感じでやってみた
class MultiHead_Attention(torch.nn.Module):
    def __init__(self, hidden_dim, output_size, dropout_p=0.1, max_length=MAX_LENGTH, head_N=32):
        super(MultiHead_Attention, self).__init__()
        self.hidden_dim = hidden_dim
        self.output_size = output_size
        self.dropout_p = dropout_p
        self.max_length = max_length
        self.head_N = head_N

        # input one-hot -> dense vector
        self.input_embedding = torch.nn.Embedding(self.output_size, hidden_dim)
        self.input_embedding_dropout = torch.nn.Dropout(dropout_p)

        # Attention Query
        #self.Q_embedding = torch.nn.Embedding(self.output_size, hidden_dim)
        #self.Q_dropout = torch.nn.Dropout(self.dropout_p)
        self.Q_dense = torch.nn.Linear(hidden_dim, hidden_dim)
        self.Q_dense_dropout = torch.nn.Dropout(dropout_p)
        #self.Q_BN = torch.nn.BatchNorm1d(hidden_dim)

        # Attention Key
        self.K_dense = torch.nn.Linear(RNN_dim, hidden_dim)
        self.K_dense_dropout = torch.nn.Dropout(dropout_p)
        #self.K_BN = torch.nn.BatchNorm1d(hidden_dim)

        # Attetion Value
        self.V_dense = torch.nn.Linear(RNN_dim, hidden_dim)
        self.V_dense_dropout = torch.nn.Dropout(dropout_p)
        #self.V_BN = torch.nn.BatchNorm1d(hidden_dim)

        # Attention mask
        #self.attention = torch.nn.Linear(hidden_dim * 2, self.max_length)
        self.attention_dense = torch.nn.Linear(hidden_dim * 2, hidden_dim)
        self.attention_dropout = torch.nn.Dropout(dropout_p)
        #self.attention_BN = torch.nn.BatchNorm1d(hidden_dim)


    def forward(self, _input, memory):
        # input embedding : onehot -> dense vector
        _input_vector = self.input_embedding(_input)

        # get Query
        Q = self.Q_dense(_input_vector.view(1, -1))
        #Q = self.Q_BN(Q)
        Q = self.Q_dense_dropout(Q)
        Q = Q.view(1, 1, -1)

        # one head -> Multi head
        Q = Q.view(1, self.hidden_dim // self.head_N, self.head_N)
        Q = Q.permute([2, 0, 1])

        # Transformer technique 1 : scaled dot product
        Q *= Q.size()[-1] ** -0.5

        # get Key
        K = self.K_dense(memory)
        #K = self.K_BN(K)
        K = self.K_dense_dropout(K)
        K = K.view(1, self.max_length, -1)

        # one head -> Multi head
        K = K.view(self.max_length, self.hidden_dim // self.head_N, self.head_N)
        K = K.permute([2, 1, 0])

        # get Query and Key (= attention logits)
        QK = torch.bmm(Q, K)
        # Transformer technique 2 : masking attention weight
        any_zero = memory.sum(dim=1)
        pad_mask = torch.ones([1, 1, self.max_length]).to(device)
        pad_mask[:, :, torch.nonzero(any_zero)] = 0
        QK += pad_mask * sys.float_info.min

        # get attention weight
        attention_weights = F.softmax(QK, dim=-1)

        # get Value
        V = self.V_dense(memory)
        #V = self.V_BN(V)
        V = self.V_dense_dropout(V)
        V = V.view(1, self.max_length, -1)

        # one head -> Multi head
        V = V.view(self.max_length, self.hidden_dim // self.head_N, self.head_N)
        V = V.permute(2, 0, 1)

        # Attetion x Value
        attention_feature = torch.bmm(attention_weights, V)

        # Multi head -> one head
        attention_feature = attention_feature.permute(1, 2, 0)
        attention_feature = attention_feature.contiguous().view(1, 1, -1)

        # attention + Input
        attention_x = torch.cat([_input_vector, attention_feature], dim=-1)

        # apply attention dense
        attention_output = self.attention_dense(attention_x)
        #attention_output = self.attention_BN(attention_output)
        attention_output = self.attention_dropout(attention_output)
        attention_output = F.relu(attention_output)

        return attention_output
Done3.学習時のランダムサンプリング
pytorchに解説サイトではteacher forcingという仕組みを採用している。
これはDecoderの入力ラベルを Encoderの出力でなく無理やり教師ラベルにする仕組みであwる。これはイテレーションごとに0.5の確率で行われた。
ここにさらにteacher forcingが行われないタイミングで、0.2の確率で、Decoderへの入力を1タイミング前の Decoder出力の確率分布からランダムサンプリングするようにした。
結果
これでここまでの結果になった
最初のことばは「どうもーサンドウィッチマンです」にしたら、なんか会話っぽいノリが出てきた
~/work_space :$ python seq2seq_pytorch.py --test
A: どうもーサンドウィッチマンです
B: よろしくお願いしまーす
A: 僕らもやってねやって、こうやってないんですけどね。
B: さっきの方が何じゃないです。
A: なんでが染めんです。
B: 外が見えねーんです。
A: あとがわりのな。
B: 相方じゃねーのなな。
A: 最近かの
B: まあ出ていいんだよちょっと。
A: あっじゃああるんです。
B: ねえじゃねえ。。の、気持ちよ。
A: お前、高橋かんですか?
B: 何だよよ。
A: 犬派派派ですか猫派派の派か?猫派って言うのか、お前。
B: 何、紅白と触れ合うてもいいですか?
A: まあ、まあのまあ
B: あっではでもいいですか?
A: まあまあまあ別にの
B: あっ麺なんです。。。。。
A: 気持ちわりーよ。だ。
B: お前、何の頃か?かをん
A: まあアンケート思っだよ。
B: あ、高橋
A: あ、ー早速て
B: あ、お前ですか?
A: ありじゃねーよ。
B: あ、高橋、「で金なんか」
A: 眠るてたのかよ?
B:
A: 何かてんの?
B: 2と
A: ただのうどんから桃桃で、だました。
B: ああ!
A: 何にイカてるんですよ、?
B: 会社員いいんですね
A: まあがシンプルなんだよ。
B: 混線が笑いちゃうのはは「はははははははは…」
A: 何にわんだよ。もうてるのわわ。。
B: ありがとうございたたございます。
A: 最近色々言わなくて。
B: 真ん中て覚えます。
A: お前!の?ね。
B: はい。
A: 何それ、お前。
B: いや、紅白に豪華にーす。
A: っとによ、お前。。によ。。に、入れてるん。よよ。
B: お前、キャンペーンからよ。
A: これ、ときの方お願いしまーす。
B: 給油口なな。
A: 何ははですか。
B: やかましねえわ。
A: 実際ないですか?
B: そうがそうなんだよ。
A: 金利、金利中のはじまりかか
B: すいません。
A: 何クイズみたいんなってんじゃん。
B: はい。あ、ちなみに持ってますか?
A: ねぇよ思っよ。
B: ない
A: 何も関係ねぇですか?
B: どっちだよ。
A: これなポケットか!
B: そうですよ、お前。
A: お前、んんのよ?
B: はい。
A: 何それ。
B: まず1日目ー、富士は樹海でーっててたんだよ。
A: お前!
B: なんだよ
A: こちらのお店にはよく来られるんですか?
B: 店長だわ。
A: 「本日は晴天が…あり
B: あ、んです。
A: おう。
B: そのまんま、静かに樹海で眠ってもらいた。
A: お前、よのかよ!
B:
A: 何かてんの?
B: 2等だよ
A: 一員ということできてた?
B: なんでいいか?っていうの話よ。
A: あっ、今、海外でーたんですよ。
B: あ!そうじゃ…、
A: あ、
B: あ、早速注文ですない
A: ありそうんだよ。
B: あっ、金利
A: すいません、行ってたの
B: えぇ、それ
A: まぁ、でもさ、さんによん
B: あそうですね
A: うん
B: 結構ね、朝から並んでくれてるんだよ。
A: お前。
B: 何にはの話だよ。
A: お前、高橋いじめなんかのかか?
B: いじめてねーわ。
A: おやってないだ、お前。
B: ない、じゃあは持っんだな。
A: ああ。
ToDo
BERTによるpretrainedモデルを使ってみたい
あとは、会話開始からの全てのhidden stateを使う仕組みを導入してみたい
- 投稿日:2019-08-30T20:07:45+09:00
(Python) DataFrame のappend 時に配列が1列の複数データで挿入される際の解決方
問題:pandas.DataFrame にappend した行の配列データが、1列に複数のデータとして入る。
pandas.DataFrame のインスタンスに行を追加しようとした際、配列データをappend メソッドで追加すると、1列に複数のデータとして入るようでした。
sample.pyfrom pandas import DataFrame dataFrame = DataFrame([ ['a','b','c','d','e'], ['f','ggg','hhhh','ii','jjjjjjjj'], ]) appendedDataFrame = dataFrame.append( ['a','b','c','d','e'] ) print(appendedDataFrame)出力結果.txt0 1 2 3 4 0 a b c d e 1 f ggg hhhh ii jjjjjjjj 0 a NaN NaN NaN NaN 1 b NaN NaN NaN NaN 2 c NaN NaN NaN NaN 3 d NaN NaN NaN NaN 4 e NaN NaN NaN NaN新規の行が 0 - 5 までのindex で複数のデータとして挿入されましたが、本来は行として挿入するつもりだったため、配列を行として一行追加する方法を調査しました。
解決法:pandas.Series のインスタンスとして append する。
一度
pandas.Seriesインスタンスに配列データを入れて、それをDataFrame の appendメソッドに渡すことで、期待するDataFrame になりました。(この時pandas.Seriesの name が append した時の行の index 名となるようでした。)sample.pyfrom pandas import DataFrame, Series dataFrame = DataFrame([ ['a','b','c','d','e'], ['f','ggg','hhhh','ii','jjjjjjjj'], ]) appendedDataFrame = dataFrame.append( Series( ['a','b','c','d','e'], name=2 ) ) print(appendedDataFrame)出力結果.txt0 1 2 3 4 0 a b c d e 1 f ggg hhhh ii jjjjjjjj 2 a b c d eこれで新たな行を DataFrame に挿入することができました。
Series には、name を設定するか、append メソッドに、igonore_index=True を設定する必要がある。
Series には、name(挿入する行のindex名)を指定しないと下記のエラーとなりました。
TypeError: Can only append a Series if ignore_index=True or if the Series has a nameSeries には、name(挿入する行のindex名)を指定しない場合、これを回避するために、ignore_index=True を設定する必要があるようです。
sample.pyfrom pandas import DataFrame, Series dataFrame = DataFrame([ ['a','b','c','d','e'], ['f','ggg','hhhh','ii','jjjjjjjj'], ]) appendedDataFrame = dataFrame.append( Series( ['a','b','c','d','e'], ), ignore_index=True ) print(appendedDataFrame)出力結果.txt0 1 2 3 4 0 a b c d e 1 f ggg hhhh ii jjjjjjjj 2 a b c d e以上です。
- 投稿日:2019-08-30T19:02:02+09:00
PyPIへのアップロード&パッケージ化を行うPowerShellスクリプトを書いた
ライブラリのアップロードはそう頻繁にあることじゃなく、ついつい手順を忘れてしまうのでスクリプトを書きました。
いちおうアップロードの直前に「本当にアップロードしても良いか?」聞くおまけ付きです。いちおう全文英語なのでOSSのリポジトリとかにうっかり入れても安心。
upload.ps1Remove-Item "*.egg-info" -Recurse Remove-Item "dist" -Recurse Remove-Item "build" -Recurse python setup.py sdist python setup.py bdist_wheel $title = "PyPI upload?" $message = "The package was created in the `dist` folder. Can I continue uploading to PyPI?" $tChoiceDescription = "System.Management.Automation.Host.ChoiceDescription" $options = @( New-Object $tChoiceDescription ("Yes(&Y)", "Upload the library to PyPI.") New-Object $tChoiceDescription ("No(&N)", "Cancel the upload. The library remains in the `dist` folder.") ) $result = $host.ui.PromptForChoice($title, $message, $options, 0) switch ($result) { 0 { twine upload dist/* break } 1 { "Cancel the upload. The library remains in the `dist` folder." break } }なお、アップロードに必要な
sdist、wheel、twineコマンドは事前にインストール済み、PyPIアカウントの情報は.pypircに記入済みであるものとします(この辺の処理がまだの人は参考記事を読んでください)。参考記事
- Pythonで作成したライブラリを、PyPIに公開/アップロードする - Qiita
- PowerShell で選択肢メニューと、それに伴う分岐処理を簡潔に書きたい - Qiita:結局複雑なコードにならなかったので、ここに書かれているコードは利用していません
- Windows PowerShell Tip of the Week | Microsoft Docs
- 投稿日:2019-08-30T18:59:41+09:00
PythonでRのパイプ演算子`%>%`の挙動をミミックする
モチベーション
RからPythonへ移行した人であれば、「Rの
hogeってPythonではどう書くんだろう?」という場面はあるのではないでしょうか。大抵はググればお目当てのものが見つかるのですが、稀に全く見つからないということがあります。今回は、PythonでRのパイプ演算子%>%を使いたいけど、求めているものが見つからなかったので、それに相当するものを実装しました。ちなみに、パイプラインに馴染みのない方は第一引数版パイプライン演算子とパイプライン演算子の歴史が参考になるので、一読しておくと良いでしょう。本題に戻ります。今回は結論から言うと以下のコードが、
unreadable.pyimport numpy as np x = [1, 2, 3, 4, 5, 6, 7, 8] np.max(np.mean(np.reshape(np.array(x), (2, 4)), axis=1))パイプ演算子を使うことで、以下のように書き直すことができます。
readable.pyfrom pipe import Pipeline x = [1, 2, 3, 4, 5, 6, 7, 8] p = Pipeline(x) >> np.array \ >> (lambda x: np.reshape(x, (2, 4)) \ >> (lambda x: np.mean(x, axis=1) \ >> np.maxパイプ演算子を使うことで、コードがかなり読みやすくなりました。パイプを使わないで
f(g(h()))と書くと、読む順番はf -> g -> hなのに対して、実際に処理される順番はh -> g -> fとなり、逆になってしみます。しかし、パイプを使うと読む順番と処理される順番が同じになるので、読んだ順番通りに処理が進むので直感的に理解しやすくなります。
このパイプ演算子を試してみたい方はgithubにソースコードをアップロードしたので、是非使ってみてください。パイプ演算子を実装する
それではパイプ演算子を実装していきます。大きく2つやることがあります。
1. Pipelineクラスの定義
2. 演算子のオーバーロード
以上の2つです。Pipelineクラスの定義
まずはPipelineクラスを定義します。
pipe.pyclass Pipeline: def __init__(self, val): self._val = val def apply(self, fn): ret = fn(self._val) return self.__class__(ret) def unwrap(self): return self._val
Pipelineはシンプルで1つのフィールドと2つのメソッドから構成されています。それぞれを順に解説します。
+__init__では与えられた値をPipelineで包むだけです。
+applyは関数を1つ引数として、その関数をself._valへと適用します。返り値は関数の適用結果をPipelineで包んだものです。
+unwrapはPipelineで包まれた値を返します。
applyの挙動が今回は最も重要で、applyの返り値がPipelineとなっていることで、unwrapをしない限り延々とapplyで処理を繋げることができます。例えば、apply_apply_apply.pyfrom pipe import Pipeline x = [1, 2, 3, 4, 5, 6] add_one = lambda x: x + 1 add_ten = lambda x: x + 10 Pipeline(x).apply(len).apply(add_one).apply(add_ten).unwrap() # > 17のように処理を繋げることができます。これでもメソッドチェーンを使うことにより、かなりパイプライクな挙動を真似することができました。後は、
.applyの部分を>>のような何かしらの演算子で書き換えることができれば、ほぼパイプ演算子の挙動を真似ることができそうです。演算子のオーバーロード
それでは
.applyを>>という演算子で置き換えられるように、演算子のオーバーロードをします。先程のpipe.pyに書き加えていきます。pipe.pyclass Pipeline: def __init__(self, val): self._val = val def apply(self, fn): ret = fn(self._val) return self.__class__(ret) def unwrap(self): return self._val def __rshift__(self, fn): return self.apply(fn) def __gt__(self, fn): return self.apply_once(fn)新たに
__rshift__と__gt__を追加しました。これで>>と>という2つの演算子の挙動を変更することができます。あくまでこれは、左辺がPipelineの時の挙動を変えるだけなので、それ以外の場面では通常通りの挙動をします。実際にPipelineが左辺にある時にどのような挙動にしたかというと、Pipeline >> fnがPipeline.apply(fn)となり、Pipeline > fnがPipeline.apply_once(fn)となるようにしました。それに以下のように>>を使って処理を繋げることができるようになります。pipe_operator.pyfrom pipe import Pipeline x = [1, 2, 3, 4, 5, 6] add_one = lambda x: x + 1 add_ten = lambda x: x + 10 p = Pipeline(x) >> len >> add_one > add_ten p.unwrap() # > 17先程のメソッドチェーンとの比較をすると、メソッドの呼び出し部分が全て演算子に置き換わっているのが分かります。これで、一応Rのパイプ演算子
%>%の挙動をPythonで真似ることができました。最後に
一応PythonでRのパイプ演算子の挙動を真似ることができました。しかし、Rのパイプ演算子とは厳密には異なっています。Rではパイプ演算子によって前の処理の結果を後の処理に渡すようになっています。しかし、今回の実装はあくまで関数の適用結果を
Pipelineで包み直すことでメソッドチェーンで繋げられるようにし、演算子のオーバーロードによりメソッド呼び出しを行うことで、パイプ演算子のように見せかけているだけです。ただ、コードを見ても分かるように、実用上はあまり大きな違いはなく、ほぼ同じ様に使うことができるでしょう。参考記事
- (void*)Pないと: 演算子のオーバーロードに関して参考にさせていただきました。
- 第一引数版パイプライン演算子: 下の記事とともに読むとパイプラインの理解の手助けになります。
- パイプライン演算子の歴史: パイプラインに関して整理されいて分かりやすいです。
- 投稿日:2019-08-30T18:51:32+09:00
超簡単 Kerasで複数Input統合モデル
Kerasで複数の情報を入力して、途中で結合する方法を紹介します。
この方法は、例えば以下のように画像とテキストを使って予測モデルを作る場合などに有効です。リンク先参考。
処理概要
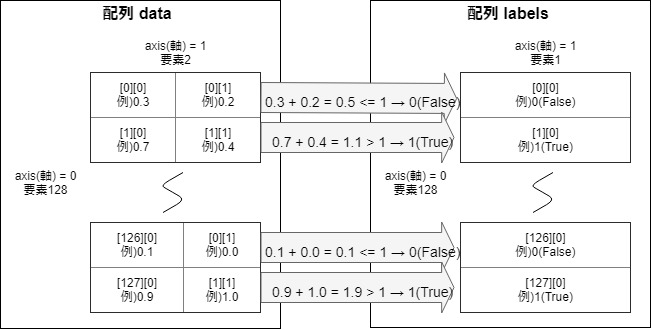
以前、記事「【Keras入門(1)】単純なディープラーニングモデル定義」で紹介した以下の図の配列dataを2つに分解して統合するモデルにしてみます。
処理プログラム
プログラム全体はGitHubを参照ください。
※なぜか直接GitHubで見られずに、nbviewerなら参照できました。nbviewerにhttps://github.com/YoheiFukuhara/keras-for-beginner/blob/master/Keras09_merge.ipynbを入力します。1. ライブラリインポート
今回はnumpyとtensorflowに統合されているkerasを使います。ピュアなkerasでも問題なく、インポート元を変えるだけです。
from random import random

import matplotlib.pyplot as plt
from tensorflow.keras.layers import Input, concatenate, Dense
from tensorflow.keras.models import Model
from tensorflow.python.keras.utils.vis_utils import plot_model
import numpy as np
2. 前処理
2.1. データ作成
入力1と入力2の和が1未満の場合は、正解ラベルを0に設定
入力1と入力2の和が1以上の場合は、正解ラベルを1に設定NUM_TRAIN = 256 x_train1 = np.empty((0, 1)) # 入力(説明変数)1 x_train2 = np.empty((0, 1)) # 入力(説明変数)2 y_train = np.empty((0, 1)) # 正解ラベル(目的変数) for i in range(NUM_TRAIN): x1 = np.array(random()) # 0から1までの乱数 x2 = np.array(random()) # 0から1までの乱数 if x1 + x2 < 1: y_train = np.append(y_train, np.zeros(1).reshape(1, 1), axis=0) else: y_train = np.append(y_train, np.ones(1).reshape(1, 1), axis=0) x_train1 = np.append(x_train1, x1.reshape(1, 1), axis=0) x_train2 = np.append(x_train2, x2.reshape(1, 1), axis=0)3. モデル定義
concatenateを使って2つの流れを統合します。concatenate以外も統合系の関数がありますが、多くの場合はconcatenateではないでしょうか。# 入力を定義 input1 = Input(shape=(1,)) input2 = Input(shape=(1,)) # 入力1から結合前まで x = Dense(1, activation="linear")(input1) x = Model(inputs=input1, outputs=x) # 入力2から結合前まで y = Dense(1, activation="linear")(input2) y = Model(inputs=input2, outputs=y) # 結合 combined = concatenate([x.output, y.output]) # 密結合 z = Dense(32, activation="tanh")(combined) z = Dense(1, activation="sigmoid")(z) # モデル定義とコンパイル model = Model(inputs=[x.input, y.input], outputs=z) model.compile(loss='binary_crossentropy', optimizer='adam', metrics=['acc']) model.summary()出力されるサマリは以下の通り。
Layer (type)                    Output Shape         Param #     Connected to
==================================================================================================
input_1 (InputLayer)            [(None, 1)]          0
__________________________________________________________________________________________________
input_2 (InputLayer)            [(None, 1)]          0
__________________________________________________________________________________________________
dense (Dense)                   (None, 1)            2           input_1[0][0]
__________________________________________________________________________________________________
dense_1 (Dense)                 (None, 1)            2           input_2[0][0]
__________________________________________________________________________________________________
concatenate (Concatenate)       (None, 2)            0           dense[0][0]
                                                                 dense_1[0][0]
__________________________________________________________________________________________________
dense_2 (Dense)                 (None, 32)           96          concatenate[0][0]
__________________________________________________________________________________________________
dense_3 (Dense)                 (None, 1)            33          dense_2[0][0]
==================================================================================================
Total params: 133
Trainable params: 133
Non-trainable params: 0
__________________________________________________________________________________________________
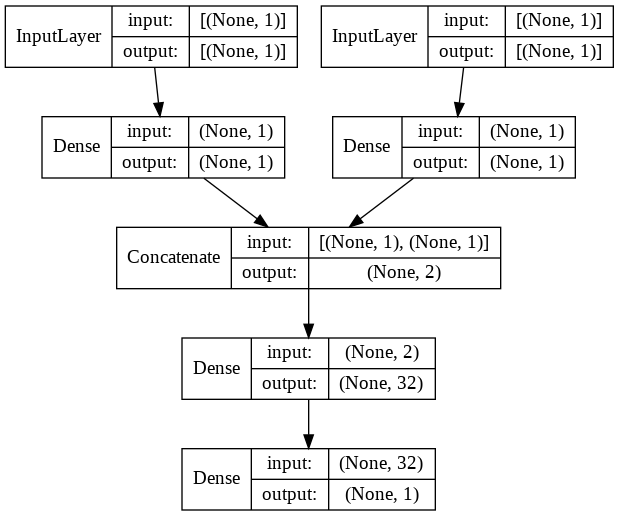
plot_modelを使って見やすくするとこんな感じです。plot_model(model, show_shapes=True, show_layer_names=False)4. 訓練実行
fit関数を使って訓練します。200epoch程度で精度が出ます。
history = model.fit([x_train1, x_train2], y_train, epochs=200)参考
記事「Kerasで複数の入力を統合/マージする方法」を参考にしました。
- 投稿日:2019-08-30T17:41:04+09:00
minicondaのインストールと仮想環境の複製・インポート
普段、pipenvを使用している私ですが、ことGPU環境の機械学習においてはminicondaを利用します。
Minicondaを使う利点
- condaでtensolflowを入れると、GPUで学習を並列処理するのに必要となるライブラリ(CUDAやcuDNN)を勝手にインストールしてくれる。 https://www.anaconda.com/tensorflow-in-anaconda/
- 仮想環境の設定ファイルが出力できるので、仮想環境の使いまわしが簡単。(pipenvのPipfileと同様)
- Anacondaと比べて、最小限の機能だけ有しているので、インストールなどが楽で気軽に手を出せる。
環境
- Ubuntu 18.04
- conda 4.7.11(2019年8月30日時点 最新)
Minicondaのインストール
wget https://repo.continuum.io/miniconda/Miniconda3-latest-Linux-x86_64.sh
bash Miniconda3-latest-Linux-x86_64.sh
参考:Minicondaのアーカイブ(Windows版、Mac版もダウンロードできます)
https://repo.continuum.io/miniconda/仮想環境の準備
仮想環境の作成
-nに環境名を設定します。conda create -n <envname> python=3.6作成した仮想環境を確認
conda info -e仮想環境の有効化
conda activate <envname>
source activate gpuenvでも仮想環境に入れるが、conda 4.4.0(2017-12-20)以降からはconda activateが推奨されている。
4.4.0 (2017-12-20) Recommended change to enable conda in your shell仮想環境の無効化
conda deactivatecondaのProxy設定(Proxy環境のみ)
設定ファイル
.condarcを作成# create '.condarc' inside home directory conda config
.condarcを編集。隠しファイルなので、lsでは表示されない。cd $home sudo vim .condarc以下の内容を転記。{}の内容は、適宜書き換え
proxy_servers: http: http://{user}:{password}@{proxy_ip_or_domain}:{proxy_port} https: http://{user}:{password}@{proxy_ip_or_domain}:{proxy_port}設定が反映されているか確認
# create '.condarc' inside home directory conda config --showパッケージのインストール
conda install ライブラリ名仮想環境の設定ファイル出力
yml形式で設定ファイルを出力します。
この設定ファイルは、GCPやAWSなどのインスタンスに同一環境を作成する際に重宝します。conda env export -n <envname> > myenv.yml設定ファイルをもとに仮想環境を複製
前項で作成した設定ファイルを、
-fオプションに指定し、conda env createを実行します。conda env create -n <envname> -f myenv.yml仮想環境が作成されているか確認
conda info -e仮想環境の削除
conda remove -n <envname> --all以上
- 投稿日:2019-08-30T16:54:22+09:00
AWS lambdaのDynamoDB更新処理で Invalid UpdateExpression: Attribute name is a reserved keywordになった時の対処方法
lambdaからDynamoDBの値を更新しようとした時に
タイトルのエラーで怒られた時の対処方法です。試しにこんな更新処理を書いてみます。
sample.pytable.update_item( Key= {'device_id': device_id}, UpdateExpression='set store = :s, updated_at = :u', ExpressionAttributeValues={ ':s' : store_name, ':u' : updated_at } )これを実行すると…
"An error occurred (ValidationException) when calling the UpdateItem operation: Invalid UpdateExpression: Attribute name is a reserved keyword; reserved keyword: store"どうやらstoreは予約語のようです。
こちらを参照
https://docs.aws.amazon.com/ja_jp/amazondynamodb/latest/developerguide/ReservedWords.html対処方法として
ExpressionAttributeNamesを使用して、
属性名をプレースホルダー名で置き換えることで解決出来ました。こんな感じです。
sample.pytable.update_item( Key= {'device_id': device_id}, UpdateExpression='set #st = :s, updated_at = :u', ExpressionAttributeNames= { '#st' : 'store' }, ExpressionAttributeValues={ ':s' : store_name, ':u' : updated_at } )無事更新を行うことが出来ました。
参考
ここにハマった!DynamoDB
https://blog.brains-tech.co.jp/entry/2015/09/30/222148DynamoDB の予約語
https://docs.aws.amazon.com/ja_jp/amazondynamodb/latest/developerguide/ReservedWords.html
- 投稿日:2019-08-30T15:51:53+09:00
Pythonではじめる機械学習 教師なし学習(PCAによる前処理)
教師なし学習の種類
- 教師なし学習にはデータセットの変換とクラスタリングの2種類がある
- 教師なし変換(データセットの変換)は,元のデータを変換してよりわかりやすく新しいデータ表現を作るアルゴリズムのことである
- 教師なし変換の手法として最も一般的ものとして次元削減がある
- 次元削減とは多くの特徴量で構成されるデータの高次元表現を入力として,少量の本質的な特徴量でそのデータを表す要約方法を見つけることである
- 可視化のために次元数を2次元に減らす際にも用いられる
- 教師なし変換は次元削減の他にも,そのデータを構成する構成する成分を見つける手法がある
- この例としてある文書からあるトピックを抽出する,つまりソーシャルメディア上の話題を解析するものがある
- クラスタリングアルゴリズム(クラスタリング)はデータを似たような要素から構成されるグループに分けるアルゴリズムである
- 例としてSNSにアップされている写真から同じ人物が写っている写真をまとめるとき,写真から全ての顔を抽出して似た顔でグループ分けをする
教師なし学習の難しさ
- 教師なし学習のアルゴリズムにはラベル情報が全く含まれないデータが与えられるため,出力結果が正解かどうかがわからない
- つまり学習したことに対しての評価が難しい
- 教師なし学習は実用として用いられることは少なく,データの理解や教師あり学習の前処理として利用されることが多い
- このようにデータを新しい表現にすることで,教師ありアルゴリズムの精度向上,メモリ消費,計算時間の面で有効な場合がある
- まずは簡単な教師なし学習に手法として,前処理とスケール変換を見てみる
前処理とスケール変換
- ニューラルネットワークやSVMのためにデータスケールの変換を,教師なし学習を用いて行う
- 特徴量ごとにスケールを変換してずらす方法が一般的に用いられ,この例を次に示す
In[1]:
%matplotlib inline
import matplotlib.pyplot as plt
import mglearn
plt.rcParams['image.cmap'] = "gray"

mglearn.plots.plot_scaling()
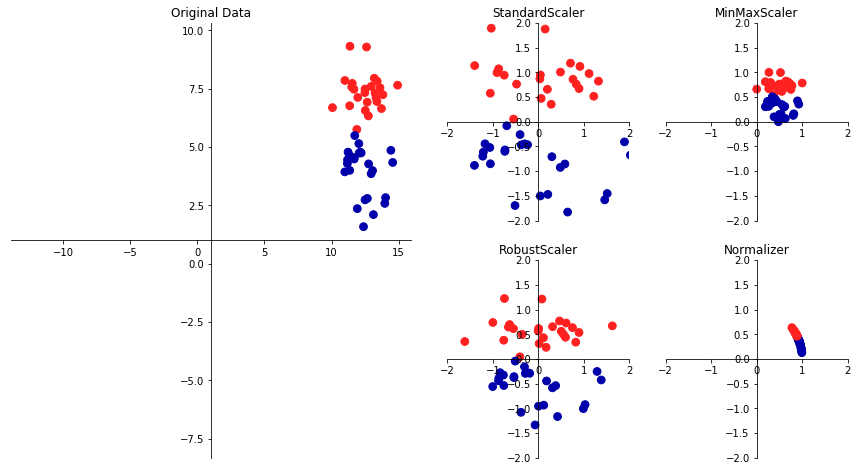
- 右のプロットは,左のプロットを4種類で変換したものである
- StandardScalerは個々の特徴量の平均が0で分散が1になるように変換し,全ての特徴量の大きさを揃えるが,特徴量の最大値や最小値の範囲内に入るとは限らない
- RobustScalerは平均値の分散に代わりに中央値を四分位数を用いるため,極端に他の値と異なるような値(外れ値)を無視する
- MinMaxScalerはデータが0から1の間に入るように変換する
- Normalizerはデータポイント半径1の円に投射するため,全てのデータポイントに対してそれぞれ異なるデータ変換が行われる
データ変換の適用
- 教師なし学習によるスケール変換の例を見てみる
- SVMをcancerデータセットに適用し,MinMaxScalerを前処理に用いる
In[2]:
from sklearn.datasets import load_breast_cancer
from sklearn.model_selection import train_test_split
cancer = load_breast_cancer()

X_train, X_test, y_train, y_test = train_test_split(cancer.data, cancer.target, random_state=1)

print(X_train.shape)
print(X_test.shape)

Out[2]:  # 30の測定結果を持つ569のデータポイント
(426, 30)
(143, 30)

In[3]:
from sklearn.preprocessing import MinMaxScaler
scaler = MinMaxScaler()

In[4]:
scaler.fit(X_train)

Out[4]:
MinMaxScaler(copy=True, feature_range=(0, 1))
- スケール変換の場合,fitにはX_trainのみを使う
- スケール変換するにはtranssformメソッドを用いる
In[5]:
X_train_scaled = scaler.transform(X_train)
print("trainsformed shape: {}".format(X_train_scaled.shape))
print("per-feature minimum before scaling:\n {}".format(X_train.min(axis=0)))
print("per-feature maximum before scaling:\n {}".format(X_train.max(axis=0)))
print("per-feature minimum after scaling:\n {}".format(X_train_scaled.min(axis=0)))
print("per-feature maximum after scaling:\n {}".format(X_train_scaled.max(axis=0)))

Out[5]:
trainsformed shape: (426, 30)
per-feature minimum before scaling:  # 変換前の各特徴量の最小値
 [6.981e+00 9.710e+00 4.379e+01 1.435e+02 5.263e-02 1.938e-02 0.000e+00
 0.000e+00 1.060e-01 5.024e-02 1.153e-01 3.602e-01 7.570e-01 6.802e+00
 1.713e-03 2.252e-03 0.000e+00 0.000e+00 9.539e-03 8.948e-04 7.930e+00
 1.202e+01 5.041e+01 1.852e+02 7.117e-02 2.729e-02 0.000e+00 0.000e+00
 1.566e-01 5.521e-02]
per-feature maximum before scaling:  # 変換前の各特徴量の最大値
 [2.811e+01 3.928e+01 1.885e+02 2.501e+03 1.634e-01 2.867e-01 4.268e-01
 2.012e-01 3.040e-01 9.575e-02 2.873e+00 4.885e+00 2.198e+01 5.422e+02
 3.113e-02 1.354e-01 3.960e-01 5.279e-02 6.146e-02 2.984e-02 3.604e+01
 4.954e+01 2.512e+02 4.254e+03 2.226e-01 9.379e-01 1.170e+00 2.910e-01
 5.774e-01 1.486e-01]
per-feature minimum after scaling:  # 変換後の各特徴量の最小値
 [0. 0. 0. 0. 0. 0. 0. 0. 0. 0. 0. 0. 0. 0. 0. 0. 0. 0. 0. 0. 0. 0. 0. 0.
 0. 0. 0. 0. 0. 0.]
per-feature maximum after scaling:  # 変換後の各特徴量の最大値
 [1. 1. 1. 1. 1. 1. 1. 1. 1. 1. 1. 1. 1. 1. 1. 1. 1. 1. 1. 1. 1. 1. 1. 1.
 1. 1. 1. 1. 1. 1.]
- 変換後は特徴量がシフトされスケール変換されているだけなので,データ配列は元のデータと同じである
- SVMにスケール変換されたデータを適用するためにはテストセットも変換する必要がある
In[6]:
X_test_scaled = scaler.transform(X_test)
print("per-feature minimum after scaling:\n {}".format(X_test_scaled.min(axis=0)))
print("per-feature maximum after scaling:\n {}".format(X_test_scaled.max(axis=0)))

Out[6]:
per-feature minimum after scaling:
 [ 0.0336031   0.0226581   0.03144219  0.01141039  0.14128374  0.04406704
  0.          0.          0.1540404  -0.00615249 -0.00137796  0.00594501
  0.00430665  0.00079567  0.03919502  0.0112206   0.          0.
 -0.03191387  0.00664013  0.02660975  0.05810235  0.02031974  0.00943767
  0.1094235   0.02637792  0.          0.         -0.00023764 -0.00182032]
per-feature maximum after scaling:
 [0.9578778  0.81501522 0.95577362 0.89353128 0.81132075 1.21958701
 0.87956888 0.9333996  0.93232323 1.0371347  0.42669616 0.49765736
 0.44117231 0.28371044 0.48703131 0.73863671 0.76717172 0.62928585
 1.33685792 0.39057253 0.89612238 0.79317697 0.84859804 0.74488793
 0.9154725  1.13188961 1.07008547 0.92371134 1.20532319 1.63068851]
- テストセットの場合は,特徴量の最小値と最大値が0から1の範囲をから出てしまっていることがわかる
- MinMaxScalerは常に訓練データとテストデータに全く同じ変換を行うためである
- またtransformは常に訓練データの最小値を引き訓練データのレンジで割るが,これらの値はテストセットの最小値やレンジとは違う場合があるからである
- 次に訓練データとテストデータを同じように変換してみる
訓練データとテストデータを同じように変換する
- 上記のことから,訓練セットとテストセットを全く同じように変換することが重要であることがわかる
- 次の例はテストセットの最小値とレンジを使うと何が起こるかを示すものである
In[7]:
from sklearn.datasets import make_blobs

# 合成データを作成
X, _ = make_blobs(n_samples=50, centers=5, random_state=4, cluster_std=2)
X_train, X_test = train_test_split(X, random_state=5, test_size=.1)

# 訓練セットとテストセットを可視化
fig, axes = plt.subplots(1, 3, figsize=(13, 4))
axes[0].scatter(X_train[:, 0], X_train[:, 1], c=mglearn.cm2(0), label="Training set", s=60)
axes[0].scatter(X_test[:, 0], X_test[:, 1], marker='^', c=mglearn.cm2(1), label="Test set", s=60)
axes[0].legend(loc='upper left')
axes[0].set_title("Original Data")

# MinMaxscalerでデータスケールを変換
scaler = MinMaxScaler()
scaler.fit(X_train)
X_train_scaled = scaler.transform(X_train)
X_test_scaled = scaler.transform(X_test)

# スケール変換されたデータの特性を可視化
axes[1].scatter(X_train_scaled[:, 0], X_train_scaled[:, 1], c=mglearn.cm2(0), label="Training set", s=60)
axes[1].scatter(X_test_scaled[:, 0], X_test_scaled[:, 1], marker='^', c=mglearn.cm2(1), label="Test set", s=60)
axes[1].set_title("Scaled Data")

# 訓練セットとセストセットをは別にスケール変換
# 最小値と最大値が0と1になる(これは悪い例)
test_scaler = MinMaxScaler()
test_scaler.fit(X_test)
X_test_scaled_badly = test_scaler.transform(X_test)

# 間違ってスケール変換されたデータを可視化
axes[2].scatter(X_train_scaled[:, 0], X_train_scaled[:, 1], c=mglearn.cm2(0), label="training set", s=60)
axes[2].scatter(X_test_scaled_badly[:, 0], X_test_scaled_badly[:, 1], marker='^', c=mglearn.cm2(1), label="test set", s=60)
axes[2].set_title("Improperly Scaled Data")

for ax in axes:
    ax.set_xlabel("Feature 0")
    ax.set_ylabel("Feature 1")
fig.tight_layout()
- 左の図は変換前のデータ,中央の図はMinMaxScalerで変換したデータ,右の図は訓練セットとテストセットを別々に変換したデータである
- 中央の図はデータの形は変わらずスケールのみが変換されているが,右の図は訓練データポイントとテストデータポイントが別々に変換されデータ自体が違うものになっている
- そのため,右の図(訓練セットとテストセットを別々に変換したもの)は間違いであることがわかる
教師あり学習における前処理の効果
- MinMaxScalerを使った場合と使っていない場合の効果を比較してみる
- まずはMinMaxScalerを使っていないものから見てみる
In[9]:
from sklearn.svm import SVC

X_train, X_test, y_train, y_test = train_test_split(cancer.data, cancer.target, random_state=0)

svm = SVC(C=100)
svm.fit(X_train, y_train)
print("Test set acuuracy: {:.2f}".format(svm.score(X_test, y_test)))

Out[9]:
Test set acuuracy: 0.63
- このようにスケール変換前の精度は非常に低いことがわかる
- 次にMinMaxScalerによる変換を行ってみる
In[10]:
# 0-1スケール変換で前処理
scaler = MinMaxScaler()
scaler.fit(X_train)
X_train_scaled = scaler.transform(X_train)
X_test_scaled = scaler.transform(X_test)

# 変換された訓練データで学習
svm.fit(X_train_scaled, y_train)

# 変換されたテストセットでスコア計算
print("Scaled test set accuracy: {:.2f}".format(svm.score(X_test_scaled, y_test)))

Out[10]:
SVM test accuracy: 0.97
- データのスケールを変換したことによって精度が向上した
- MinMaxScalerだけでなく,他のアルゴリズムを用いる場合はクラスを書き換えるだけで良い
In[11]:
# 平均を0分散を1として前処理
from sklearn.preprocessing import StandardScaler
scaler = StandardScaler()
scaler.fit(X_train)
X_train_scaled = scaler.transform(X_train)
X_test_scaled = scaler.transform(X_test)

# 変換された訓練データで学習
svm.fit(X_train_scaled, y_train)

# 変換されたテストセットで学習
print("SVM test accuracy: {:.2f}".format(svm.score(X_test_scaled, y_test)))

Out[11]:
SVM test accuracy: 0.96
PCAで出来ること
- 教師なし学習によるデータ変換は可視化やデータの圧縮などのためによく用いられる
- 特にこれらに用いられるアルゴリズムとして主成分分析(PCA)があげられる
- 主成分分析とは,データセットの特徴量を相互に統計的に関与しないように回転し,データを説明するのに重要な特徴量の一部のみを抜き出す
- 次にPCAを合成2次元データセットに適用した例を示す
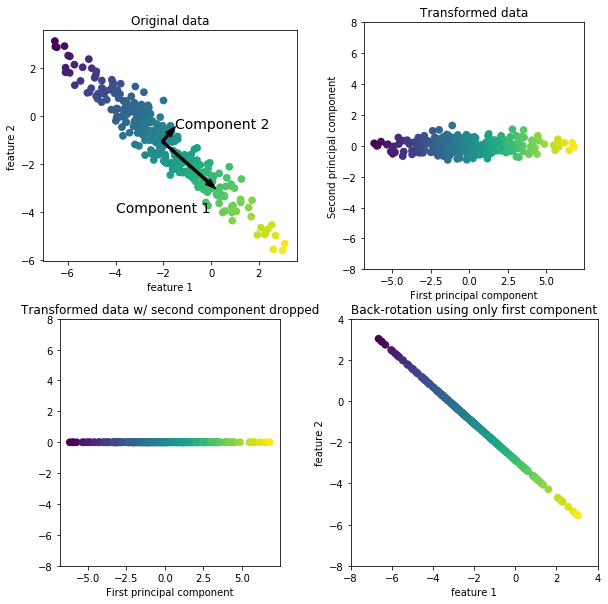
In[12]: mglearn.plots.plot_pca_illustration()左上のデータ
- pcaは,まず最も分散が多い方向(特徴量が最も相互に関係する方向)を探し「第一主成分」というラベルをつけ,次に第一主成分と直角に交わる方向の中から最も情報を持っている方向(第二主成分)を見つける
- この2つの成分で重要なのは矢印の方向ではなく,傾きと大きさである
- このようにして見つけていく方向を主成分と呼ぶ
- 主成分は特徴量と同じ数だけ存在する
右上のデータ
- 第一主成分がx軸に沿い,第二主成分がy軸に沿うように回転した(変換した)ものである
- 回転する前にデータから平均値を引くことで,原点の周辺にデータが来るようにしている
- この表現でのデータの相関行列は,対角成分を除きゼロである
左下のデータ
- 主成分のうちいくつかを残すことで次元削減を行ったもの
- ここでは第一主成分のみを残すことで,2次元のデータセットが1次元になっている
右下のデータ
- 逆回転して平均を足したものである
- データポイントは元の特徴量空間にあるが,第一主成分の情報のみしか維持されていない
- このような変換は,データからノイズを取り除いたり,主成分で維持された情報を可視化したりするために用いられる
cancerデータセットのPCAによる可視化
- PCAは高次元のデータセット可視化に用いられることが一般的である
- 基本的に2つ以上の特徴量を持つデータセット(高次元のデータセット)を可視化することが難しいが,PCAを用いることによって可視化することができる
- cancerデータセットを用いてこの例を見てみる
In[13]:
fig, axes = plt.subplots(15, 2, figsize=(10, 20))
malignant = cancer.data[cancer.target == 0]
benign = cancer.data[cancer.target == 1]

ax = axes.ravel()

for i in range(30):
    _, bins = np.histogram(cancer.data[:, i], bins=50)
    ax[i].hist(malignant[:, i], bins=bins, color=mglearn.cm3(2), alpha=.5)
    ax[i].hist(benign[:, i], bins=bins, color=mglearn.cm3(2), alpha=.5)
    ax[i].set_title(cancer.feature_names[i])
    ax[i].set_yticks(())
ax[0].set_xlabel("Feature magnitude")
ax[0].set_ylabel("Frequency")
ax[0].legend(["malignant", "benign"], loc="best")
fig
fig.tight_layout()
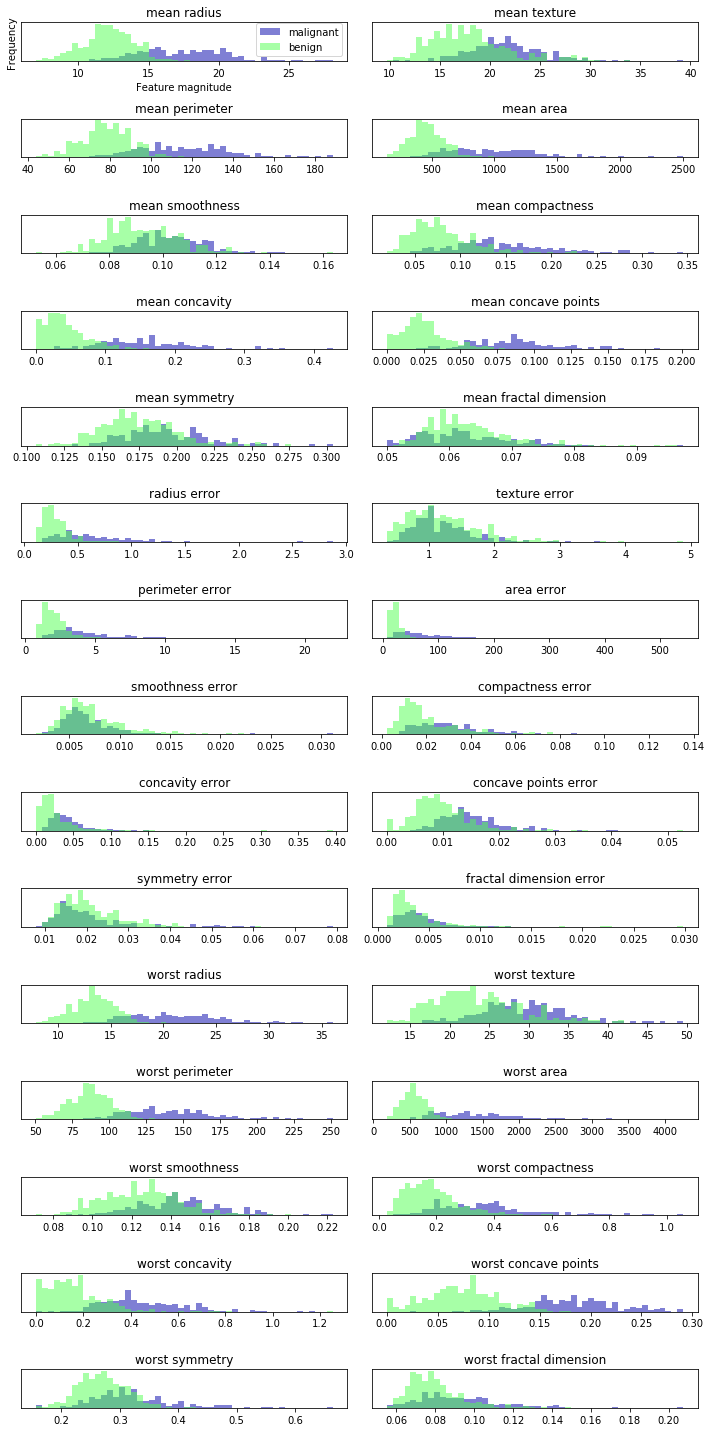
- これは個々のデータポイントが特徴量の特定のレンジ(ビンと呼ぶ)に入った回数を数えることで,特徴量ごとにヒストグラムを作っている
- 良性(緑)クラスと悪性クラス(青)が重ねられており,これを読み取ることでどの特徴量が良性か悪性かを見分けることができる
- 例えば「smoothness error」のヒストグラムはほとんど重なっているため情報が少なく,「worst concave points」はほとんど重なっておらず良性と悪性の判断をつけやすい
- しかしこのプロットを見ても特徴量の相関や,クラス分類への影響などはわからない
- なのでPCAを用いてわかりやすいもの2次元空間上に散布図として表す
In[14]:
from sklearn.datasets import load_breast_cancer
cancer = load_breast_cancer()

scaler = StandardScaler()
scaler.fit(cancer.data)
X_scaled = scaler.transform(cancer.data)

In[15]:
from sklearn.decomposition import PCA
# データの最初の2つの主成分のみを維持する
pca = PCA(n_components=2)
# cancerデータセットにPCAを適合
pca.fit(X_scaled)

# 最初の2つの主成分に対してデータポイントを変換
X_pca = pca.transform(X_scaled)
print("Original shape: {}".format(str(X_scaled.shape)))
print("Reduced shape: {}".format(str(X_pca.shape)))

Out[15]:
Original shape: (569, 30)  # 元の形
Reduced shape: (569, 2)  # 次元削減後の形
- 次元削減の流れとしてはPCAオブジェクトを作成し,fitで主成分を見つけ,transformにより回転と次元削減を行う
- 次元削減を行ったことによりプロットできるようになった
- 次にこれをプロットする
In[16]:
# 第一主成分と第二主成分によるプロット
plt.figure(figsize=(8, 8))
mglearn.discrete_scatter(X_pca[:, 0], X_pca[:, 1], cancer.target)
plt.legend(cancer.target_names, loc="best")
plt.gca().set_aspect("equal")
plt.xlabel("First principal component")
plt.ylabel("Second principal component")
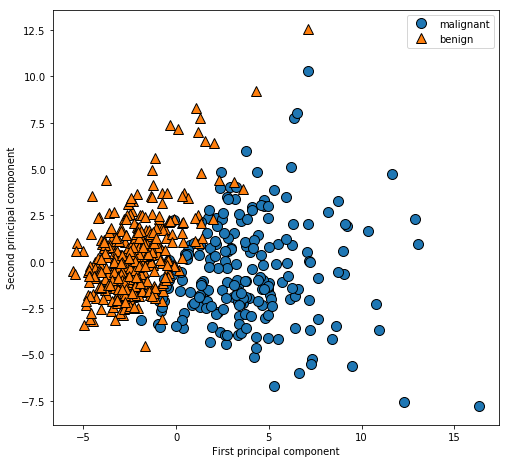
- PCAは教師なし学習なのでクラス情報を用いておらずデータの相関を見ているだけである
- PCAの欠点はプロットした2つの軸(ここでは第一主成分と第二主成分)の解釈が難しいことである
- この2つの成分は元のデータの方向(特徴量の組み合わせ)にすぎないが,この特徴量の組み合わせが非常に複雑である
- どれほど複雑なのかは次の例で見てみる
In[17]:
print("PCA components shape: {}".format(pca.components_.shape))

Out[17]:
PCA components shape: (2, 30)

In[18]:
print("PCA components:\n{}".format(pca.components_))

Out[18]:
PCA components:
[[ 0.21890244  0.10372458  0.22753729  0.22099499  0.14258969  0.23928535
   0.25840048  0.26085376  0.13816696  0.06436335  0.20597878  0.01742803
   0.21132592  0.20286964  0.01453145  0.17039345  0.15358979  0.1834174
   0.04249842  0.10256832  0.22799663  0.10446933  0.23663968  0.22487053
   0.12795256  0.21009588  0.22876753  0.25088597  0.12290456  0.13178394]
 [-0.23385713 -0.05970609 -0.21518136 -0.23107671  0.18611302  0.15189161
   0.06016536 -0.0347675   0.19034877  0.36657547 -0.10555215  0.08997968
  -0.08945723 -0.15229263  0.20443045  0.2327159   0.19720728  0.13032156
   0.183848    0.28009203 -0.21986638 -0.0454673  -0.19987843 -0.21935186
   0.17230435  0.14359317  0.09796411 -0.00825724  0.14188335  0.27533947]]
- conponents_のそれぞれの行が1つの主成分に対応する
- 行は重要度によってソートされており,列は元データの特徴量に対応する(ここでは「mean radius」や「mean texture」など)
- まだわかりにくいため,次にヒートマップで示している
In[19]:
plt.matshow(pca.components_, cmap='viridis')
plt.yticks([0, 1], ["First component", "Second component"])
plt.colorbar()
plt.xticks(range(len(cancer.feature_names)), cancer.feature_names, rotation=60, ha='left')
plt.xlabel("Feature")
plt.ylabel("Principal components")
- 第一主成分が全て同じ符号(ここでは正の符号)になっており,これは全ての特徴量に一般的な相関があることを意味する(ある特徴量が大きければ他の特徴量も大きくなる傾向にある)
- しかし第二主成分は符号が入り混じっていることに加え,第一主成分と第二主成分の両者とも30の特徴量全てが混ざっているため,この軸の意味を説明は難しい
固有顔による特徴量抽出
- PCAでは次元削減の他に特徴量抽出が可能である
- 特徴量抽出により,元のデータ表現より解析に適した表現を見つけることが可能である
- 特徴量抽出が適しているものとして画像関連の解析が挙げられる
- PCAを用いた画像からの特徴量抽出の例を見てみる
In[20]:
from sklearn.datasets import fetch_lfw_people
people = fetch_lfw_people(min_faces_per_person=20, resize=0.699)
image_shape = people.images[0].shape

fig, axes = plt.subplots(2, 5, figsize=(15, 8),
                         subplot_kw={'xticks': (), 'yticks': ()})
for target, image, ax in zip(people.target, people.images, axes.ravel()):
    ax.imshow(image)
    ax.set_title(people.target_names[target])
- このデータセットはインターネットから集めた有名人の顔画像で構成されたものである
- 次にデータセットの中身を見ていく
In[21]:
print("people.images.shape: {}".format(people.images.shape))
print("Number of classes: {}".format(len(people.target_names)))

Out[21]:
people.images.shape: (3023, 87, 65)
Number of classes: 62

In[22]:
# 各ターゲットの出現回数をカウント
counts = np.bincount(people.target)
# ターゲット名と出現回数を並べて表示
for i, (count, name) in enumerate(zip(counts, people.target_names)):
    print("{0:25} {1:3}".format(name, count), end='  ')
    if (i + 1) % 3 == 0:
        print()

Out[22]:
Alejandro Toledo           39  Alvaro Uribe               35  Amelie Mauresmo            21
Andre Agassi               36  Angelina Jolie             20  Ariel Sharon               77
Arnold Schwarzenegger      42  Atal Bihari Vajpayee       24  Bill Clinton               29
Carlos Menem               21  Colin Powell              236  David Beckham              31
Donald Rumsfeld           121  George Robertson           22  George W Bush             530
Gerhard Schroeder         109  Gloria Macapagal Arroyo    44  Gray Davis                 26
Guillermo Coria            30  Hamid Karzai               22  Hans Blix                  39
Hugo Chavez                71  Igor Ivanov                20  Jack Straw                 28
Jacques Chirac             52  Jean Chretien              55  Jennifer Aniston           21
Jennifer Capriati          42  Jennifer Lopez             21  Jeremy Greenstock          24
Jiang Zemin                20  John Ashcroft              53  John Negroponte            31
Jose Maria Aznar           23  Juan Carlos Ferrero        28  Junichiro Koizumi          60
Kofi Annan                 32  Laura Bush                 41  Lindsay Davenport          22
Lleyton Hewitt             41  Luiz Inacio Lula da Silva  48  Mahmoud Abbas              29
Megawati Sukarnoputri      33  Michael Bloomberg          20  Naomi Watts                22
Nestor Kirchner            37  Paul Bremer                20  Pete Sampras               22
Recep Tayyip Erdogan       30  Ricardo Lagos              27  Roh Moo-hyun               32
Rudolph Giuliani           26  Saddam Hussein             23  Serena Williams            52
Silvio Berlusconi          33  Tiger Woods                23  Tom Daschle                25
Tom Ridge                  33  Tony Blair                144  Vicente Fox                32
Vladimir Putin             49  Winona Ryder               24
- 3023個の画像(87x65ピクセル 62名の顔)を表示した
- しかしGeorge W BushやColin Powellなどの画像が多く,偏ったデータとなっている
- このままでは特徴量抽出がGeorge W BushやColin Powellばかりになってしまうため,各人の画像を50に制限することで偏りを緩和する
In[23]:
mask = np.zeros(people.target.shape, dtype=np.bool)
for target in np.unique(people.target):
    mask[np.where(people.target == target)[0][:50]] = 1

X_people = people.data[mask]
y_people = people.target[mask]

# 0から255で表現されたグレースケールの値0と1の間に変換(この変換の方が数値的に安定する)
X_people = X_people / 255.
- 各人の画像を50までに制限した
- 顔認識の一般的な流れとして,個々の人物(クラス)に対してクラス分類器をかける方法が挙げられる
- しかし顔データでは十分に学習出来るほどの画像(クラスの訓練データ)を用意することや,新しく人物を追加する際に大きなモデルを再訓練することが困難である
- これを解決する方法として1-最近傍法クラス分類器(クラス分類しようとしている顔に一番近いものを探す)がある
- 1-最近傍法はクラスごとに訓練サンプルが1つあれば機能するはずなので,データ数が少ない顔画像においても有効である
- 次に1-最近傍法がどの程度機能するかを見ていく
In[24]:
from sklearn.neighbors import KNeighborsClassifier

X_train, X_test, y_train, y_test = train_test_split(X_people, y_people, stratify=y_people, random_state=0)
knn = KNeighborsClassifier()
knn.fit(X_train, y_train)
print("Train set score of 1-KNeighborsClassifier: {:.2f}".format(knn.score(X_test, y_test)))

Out[24]:
Train set score of 1-KNeighborsClassifier: 0.22
- 精度は22%(おおよそ4~5回に1回人物を特定する)となっており一見すると非常に低いように思うが,62クラス分類であることを考慮すると可もなく不可もなくである
- ここでPCAの前処理を行うことで精度の向上を図る
- 顔認識は相互の画像のピクセル値を比較するため,ピクセルが1つずれるだけで表現が全く別のものになってしまう
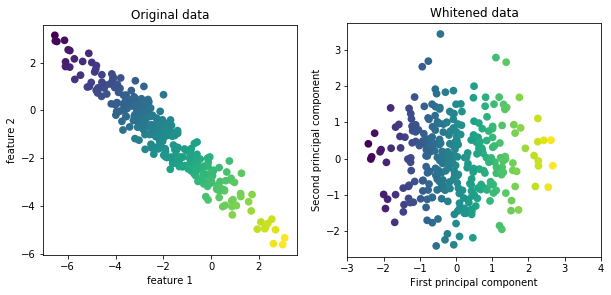
- そのため主成分が同じになるようにスケール変換する
- またwhitenオプションを使い,円を描くようにスケール変換する
In[25]:
mglearn.plots.plot_pca_whitening()
- 次に最初の100成分を抜き出し,訓練データとテストデータを変換する
- 変換後に1-最近傍法クラス分類を行う
In[26]:
pca = PCA(n_components=100, whiten=True, random_state=0).fit(X_train)
X_train_pca = pca.transform(X_train)
X_test_pca = pca.transform(X_test)

print("X_train_pca.shape: {}".format(X_train_pca.shape))

Out[26]:  # 100の特徴量をもつ
X_train_pca.shape: (1547, 100)

In[27]:
knn = KNeighborsClassifier(n_neighbors=3)
knn.fit(X_train_pca, y_train)
print("Test set accuracy: {:.2f}".format(knn.score(X_test_pca, y_test)))

Out[27]:
Test set accuracy: 0.31
- PCAによるスケール変換を行った後に,1-最近傍点法を用いると精度が22%から31%まで向上した
- これは主成分がデータのより良い表現となっているということを裏づけている
- 画像データについては見つけた主成分を簡単に可視化することが可能である
- 主成分は入力空間の方向に対応し,ここでの空間の方向は87x65ピクセルのグレースケール画像になる
- 次に最初のいくつかの主成分を見ていく
In[28]:
print("pca.components_.shape: {}".format(pca.components_.shape))

Out[28]:
pca.components_.shape: (100, 5655)

In[29]:
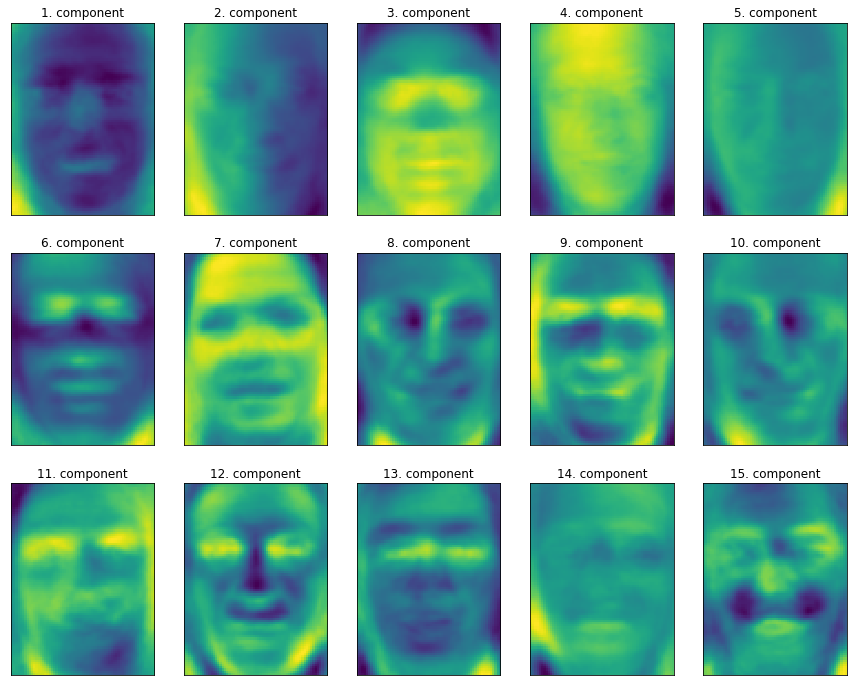
fix, axes = plt.subplots(3, 5, figsize=(15, 12), subplot_kw={'xticks': (), 'yticks': ()})
for i, (component, ax) in enumerate(zip(pca.components_, axes.ravel())):
    ax.imshow(component.reshape(image_shape), cmap='viridis')
    ax.set_title("{}. component".format((i + 1)))
- 顔と背景のコントラストや,顔への光の当たり具合などを主成分としており,これによって顔を区別している
- しかし人間が顔を判別する時にはこのような方法はとらないため,アルゴリズムの顔データ解釈は人間が行っている顔データ解釈と大きく異なっていることに注意する
- PCAの理解を深めるために,主成分の一部だけを使って画像を再現してみる
- Out[12]右下の図(第二主成分だけを落とす→逆回転した後に平均値を足す→削除した第二主成分を新たな点としてもとの空間に戻す)のような変換を顔画像にも適用することが出来る
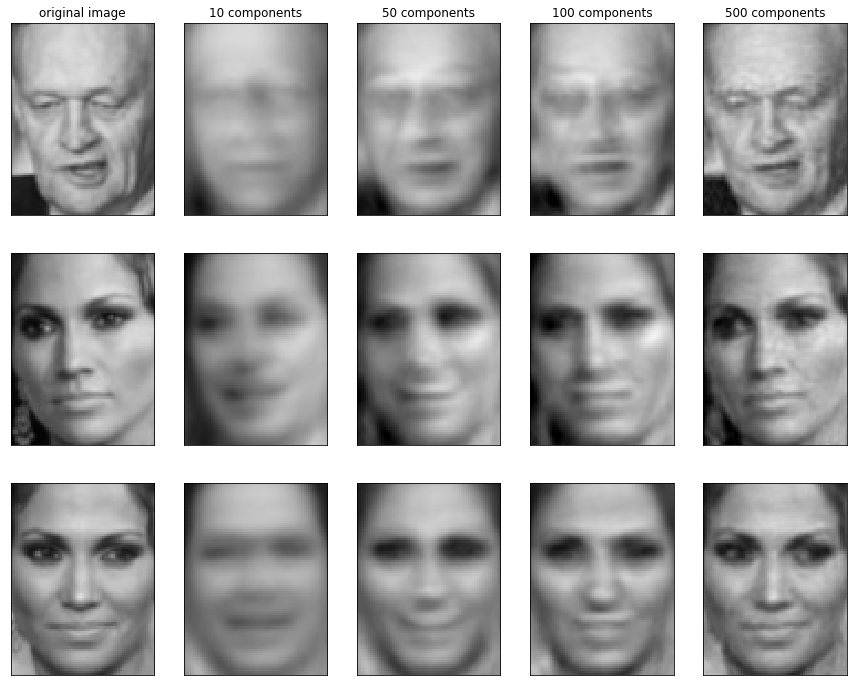
- 次に10,50,100,500個の主成分を用いて再構成したものを例をして表示する
In[30]:
mglearn.plots.plot_pca_faces(X_train, X_test, image_shape)
- 主成分が増えるにつれて画像の詳細が再構成される
- つまりピクセル数と同等の主成分(完全な画像)を使うことは,回転後に情報を全く落とさないことを意味している
- これはPCAがy = w[0] × x[0] + w[1] × x[1]...の中で主成分を重み付き和(主成分 = w[0]やw[1])としていることを示している
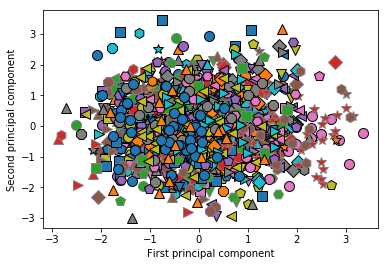
- 主成分が少ないとクラス分類が難しいということをさらに理解するために,次にOut[16]のようにPCAを用いてデータセット中の全ての顔を2つの主成分を用いてプロットしてみる
In[31]:
mglearn.discrete_scatter(X_train_pca[:, 0], X_train_pca[:, 1], y_train)
plt.xlabel("First principal component")
plt.ylabel("Second principal component")
- このように2つの主成分だけではクラス分類がほぼ不可能であることがわかる
- Out[30]で10個の主成分を用いても画像が荒く,顔の判別(クラス分類)が難しいことからも,クラス分類には多くの主成分が必要であることがわかる
- 投稿日:2019-08-30T15:32:16+09:00
PythonからOpenCVのcontribを使用する
背景
macOSではOpenCVをbrew経由でインストール可能だが、SIFTなどcontribに含まれる機能を使うことはできない(昔はcontribもインストールできたが今はできなくなってしまった)。
contribの機能を使うには自前でOpenCVをビルドしなければならない。
自分の作業メモ的に記録しておく。
この記事ではOpenCV4(4.1.0)のインストールを想定している。1. OpenCVのダウンロード
下記URLからOpenCVのソースコードをダウンロード
https://github.com/opencv/opencv/releases
適当な場所に解凍する2. OpenCV contribのダウンロード
下記URLからOpenCV contribのソースコードをダウンロード
https://github.com/opencv/opencv_contrib/releases
適当な場所に解凍する。OpenCVの解凍して出てきたフォルダ直下に適当な名前で解凍しておくとよい(contribなど)。3. cmakeの設定
ついでにcmakeもインストール
https://cmake.org/download/
OpenCVのビルドのために必要。4. OpenCVのビルド
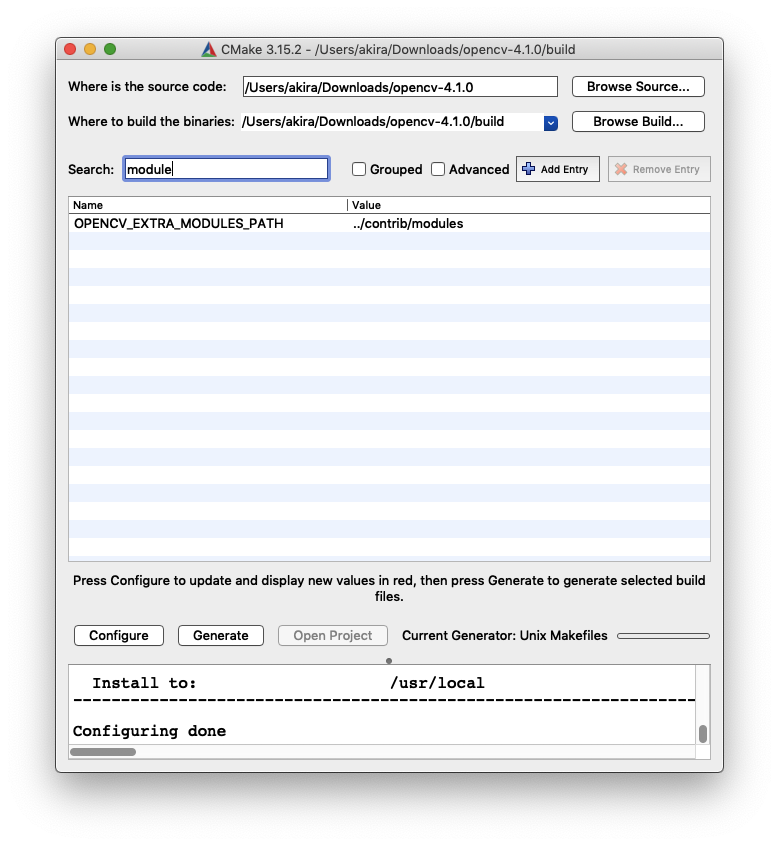
cmakeを起動し、ビルドの設定を行う。
- Configure、Generateをクリックしてmakeファイルを生成
- コマンドラインから
make、ビルドが終わったらmake installを実行する5. opencv-python, opencv-contrib-pythonをインストール
Python経由でOpenCVを触るために下記のソフトをpipでインストール
- https://pypi.org/project/opencv-python/
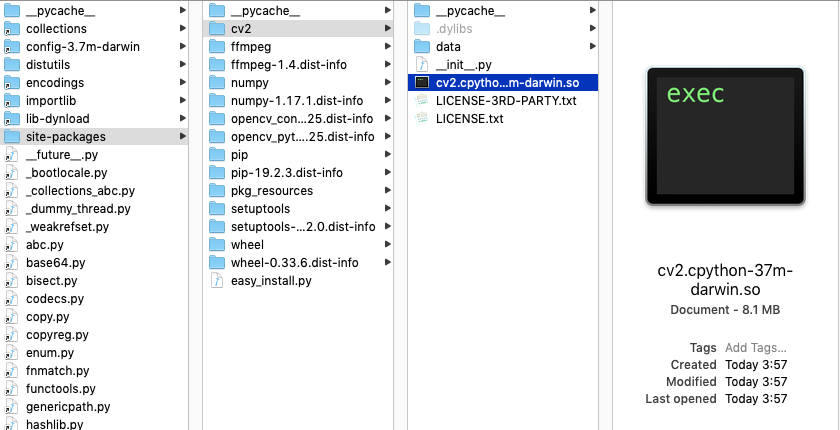
- https://pypi.org/project/opencv-contrib-python/6. ビルド結果をpythonのパッケージにコピーする
- 投稿日:2019-08-30T15:06:01+09:00
Pythonの特殊メソッド一覧を備忘録としてまとめてみた。
特殊メソッド利用
- オブジェクトの振る舞いの変更、特殊な挙動を持たせたい場合に特殊メソッドを使用する
- インスタンスに対して演算子を使った操作ができる
- 演算子使用時に特殊メソッドが呼び出される
算術演算子を定義する特殊メソッド
__add__(self,オブジェクト):「+」で足し算を行うときに呼び出されるメソッド(+演算子使用時に呼び出される)__sub__(self,オブジェクト):「―」で引き算を行うときに呼び出されるメソッド__mul__(self,オブジェクト):「*」で掛け算を行うときに呼び出されるメソッド__truediv__(self,オブジェクト):「/」で割り算を行うときに呼び出されるメソッド__floordiv__(self,オブジェクト):「//」で割り算を行うときに呼び出されるメソッド(小数点以下切り捨てで整数値で返す)なお、
__isadd__(),__issub__()のように上記のメソッド名の頭にisを加えると複合演算子「+=」、「-=」、を定義できる。他も同様。class Car(): def __init__(self,value): self.value = value def __add__(self,other): return self.value + other.value def __sub__(self,other): return self.value - other.value def __mul__(self,other): return self.value * other.value def __truediv__(self,other): return self.value / other.value def __floordiv__(self,other): return self.value // other.value car1 = Car(10) car2 = Car(20) print(car1+car2) #30 print(car1-car2) #-10 print(car1*car2) #200 print(car1/car2) #0.5 print(car1//car2) #0ビット演算子を定義する特殊メソッド
__and__(self,オブジェクト):「&」を使うときに呼び出されるメソッド__or__(self,オブジェクト):「|」を使うときに呼び出されるメソッドclass Car(): def __init__(self,value): self.value = value def __and__(self,other): return self.value & other.value def __or__(self,other): return self.value | other.value car1 = Car(1) car2 = Car(0) print(car1&car2) #0 print(car1|car2) #1比較演算子を定義する特殊メソッド[拡張比較 (rich comparison) メソッド]
__eq__(self,オブジェクト):「==」を使うときに呼び出されるメソッド__ne__(self,オブジェクト):「!=」を使うときに呼び出されるメソッド__lt__(self,オブジェクト):「<」を使うときに呼び出されるメソッド(less thanの意)__gt__(self,オブジェクト):「>」を使うときに呼び出されるメソッド(greater thanの意)class Car(): def __init__(self,value): self.value = value def __eq__(self,other): return self.value == other.value def __ne__(self,other): return self.value != other.value def __lt__(self,other): return self.value < other.value def __gt__(self,other): return self.value > other.value car1 = Car(1) car2 = Car(0) print(car1==car2) print(car1!=car2) print(car1<car2) print(car1>car2) #以下、結果 False True False True型変換を定義する特殊メソッド
__int__(self):int()関数を使うときに呼び出されるメソッド__float__(self):float()関数を使うときに呼び出されるメソッド__str__(self):str()関数,組み込み関数 format(), print() を使うときに呼び出されるメソッド__repr__(self):オブジェクトの文字列表記(オブジェクトの印字可能な表現を含む文字列)を返すメソッド※
__str__(self)と__repr__(self)の違いについては下記記載なお参考までに:[http://taustation.com/python3-str-repr/], [https://gammasoft.jp/blog/use-diffence-str-and-repr-python/]
__bytes__(self):bytes()関数を使うときに呼び出されるメソッド__format__(self,form_spec):format()メソッド使用時に呼び出される[https://docs.python.org/ja/3/library/functions.html#format]class Car(): def __init__(self,value): self.value = value self.str = "あいうえお" def __int__(self): return int(self.value) def __float__(self): return float(self.value) # def __str__(self): # return str(self.value) def __repr__(self): return repr(self.value) def __bytes__(self): return bytes(self.value) def __format__(self, form_spec): return self.str car1 = Car(1) car_str = Car("a") print(int(car1)) print(float(car1)) print(str(car1)) print(car_str) print('{}'.format(car1,0)) repr(car1) #以下、結果 1 1.0 1 'a' あいうえお※str()メソッドと repr()について
#__str__()メソッドと __repr__()を定義しなかったとき
print(str(car1))     #<__main__.Car object at 0x000002A4A2B16F60>
print(car1)          #<__main__.Car object at 0x000002A4A2B16F60>
print(car_str)       #<__main__.Car object at 0x000002A4A2B16940>

#__str__()だけを定義したとき
car1 = Car(1)
car_str = Car("a")
print(str(car1))  #1
print(car1)       #1
print(car_str)    #a

#__repr__()だけを定義したとき
car1 = Car(1)
car_str = Car("a")
print(str(car1)) #1
print(car1)      #1
print(car_str)   #'a'

# 両方定義したとき
import datetime
today = datetime.date.today()
print(str(today))    #2019-08-19
print(repr(today))   #datetime.date(2019, 8, 19)
コンテナ型で利用する特殊メソッド
- コンテナ型とはリストやタプル、ディクショナリのように、複数の要素数を持つ型の総称
__len__(self):組み込み関数len()を呼び出したときに実行されるメソッド__getitem__(self,キー):要素を参照(list[1],d["key"])するときに呼び出されるメソッド__setitem__(self,キー):引数のキーに要素を代入メソッド__delitem__(self,キー):del文が使用されたときに呼び出されるメソッド__iter__(self):iter()関数使用時に呼び出される__conteins__(self):比較演算子「in」が使われたときに呼び出されるメソッド(戻り値はTrueかFalse)アトリビュートのアクセスに利用される特殊メソッド
__getattr__(self,アトリビュート名):未定義のアトリビュートが参照されるときに呼び出されるメソッド__getattribute__(self,キー):全てのアトリビュートが参照されるときに呼び出されるメソッド__setatter__(self,キー):オブジェクトのアトリビュートに代入しようとするときに呼び出されるメソッド(このメソッド内で代入を行わないとアトリビュートに追加ができない参考文献
- みんなのPython 第4版
- エキスパートPythonプログラミング改訂2版
- 投稿日:2019-08-30T14:23:41+09:00
python xlwings 列挿入
余計なインポートたくさんありますがxlwingsがあればいけると思います。
概要:同階層にあるエクセル開いてC列にインサートして右にずらす
insert.pyimport sys import os import glob import re import os.path import string import shutil import struct import xlwings as xw from xlwings import constants from xlwings import Book from xlwings import Sheet from xlwings import Range def main(): path=os.path.dirname(os.path.abspath(__file__)) wb = xw.Book(path + "\\test.xlsx") #C列指定のインサートじゃい! wb.sheets(1).range('c:c').api.Insert() #オプション付き #wb.sheets(1).range('c:c').api.Insert(constants.Direction.xlToRight) print("Finish!!!!") ################################################# if __name__ == '__main__': main()一番重要な所はここでVBAとopenpyxlにはRangeクラスにInsertがあるのですがxlwingsには無いです。
wb.sheets(1).range('c:c').api.Insert()
なので「api」を使用してVBAの関数達を呼ばないといけません。罠かよ。
apiでリファレンスにはネイティブオブジェクトを返す。とだけしかないてないのでネイティブオブジェクトなんだよってスルーしてたのですが超重要だった。apiはインテリセンスが自分の場合は出てこなくてVBAの関数リスト見ながら叩きました。
あとはインサート時に右にずらすとかそういうオプションはconstants.Direction.xlToRightだと思う。おすすめのデバッグ方法はエクセル開きっぱなして実行していった方が良いです。
最終的にはsave closeよばないとですが開発中で見ながらできるので分かりやすい。
実行に失敗するとエクセルのプロセスが貯まってタスクマネージャー開いてわざわざ消さないとなので
面倒くさい。
- 投稿日:2019-08-30T13:15:18+09:00
LightGBMがimportできない場合
Macで機械学習しているときにLightGBMを使おうとすると
[2019-08-30 13:08:07,214] ERROR in app: Exception on / [GET]
Traceback (most recent call last):
  File "/private/var/folders/59/gg2vm1h52x7fz0254tg9x29c0000gn/T/tmpjI55tQ/lib/python3.7/site-packages/flask/app.py", line 2292, in wsgi_app
    response = self.full_dispatch_request()
  File "/private/var/folders/59/gg2vm1h52x7fz0254tg9x29c0000gn/T/tmpjI55tQ/lib/python3.7/site-packages/flask/app.py", line 1815, in full_dispatch_request
    rv = self.handle_user_exception(e)
  File "/private/var/folders/59/gg2vm1h52x7fz0254tg9x29c0000gn/T/tmpjI55tQ/lib/python3.7/site-packages/flask/app.py", line 1718, in handle_user_exception
    reraise(exc_type, exc_value, tb)
  File "/private/var/folders/59/gg2vm1h52x7fz0254tg9x29c0000gn/T/tmpjI55tQ/lib/python3.7/site-packages/flask/_compat.py", line 35, in reraise
    raise value
  File "/private/var/folders/59/gg2vm1h52x7fz0254tg9x29c0000gn/T/tmpjI55tQ/lib/python3.7/site-packages/flask/app.py", line 1813, in full_dispatch_request
    rv = self.dispatch_request()
  File "/private/var/folders/59/gg2vm1h52x7fz0254tg9x29c0000gn/T/tmpjI55tQ/lib/python3.7/site-packages/flask/app.py", line 1799, in dispatch_request
    return self.view_functions[rule.endpoint](**req.view_args)
  File "/private/var/folders/59/gg2vm1h52x7fz0254tg9x29c0000gn/T/tmpjI55tQ/lib/python3.7/site-packages/lightgbm/__init__.py", line 8, in <module>
    from .basic import Booster, Dataset
  File "/private/var/folders/59/gg2vm1h52x7fz0254tg9x29c0000gn/T/tmpjI55tQ/lib/python3.7/site-packages/lightgbm/basic.py", line 34, in <module>
    _LIB = _load_lib()
  File "/private/var/folders/59/gg2vm1h52x7fz0254tg9x29c0000gn/T/tmpjI55tQ/lib/python3.7/site-packages/lightgbm/basic.py", line 29, in _load_lib
    lib = ctypes.cdll.LoadLibrary(lib_path[0])
  File "/usr/local/Cellar/python/3.7.4/Frameworks/Python.framework/Versions/3.7/lib/python3.7/ctypes/__init__.py", line 442, in LoadLibrary
INFO     2019-08-30 04:08:07,234 module.py:861] default: "GET / HTTP/1.1" 500 290
    return self._dlltype(name)
  File "/usr/local/Cellar/python/3.7.4/Frameworks/Python.framework/Versions/3.7/lib/python3.7/ctypes/__init__.py", line 364, in __init__
    self._handle = _dlopen(self._name, mode)
OSError: dlopen(/private/var/folders/59/gg2vm1h52x7fz0254tg9x29c0000gn/T/tmpjI55tQ/lib/python3.7/site-packages/lightgbm/lib_lightgbm.so, 6): Library not loaded: /usr/local/opt/libomp/lib/libomp.dylib
  Referenced from: /private/var/folders/59/gg2vm1h52x7fz0254tg9x29c0000gn/T/tmpjI55tQ/lib/python3.7/site-packages/lightgbm/lib_lightgbm.so
  Reason: image not found
^CINFO     2019-08-30 04:08:26,325 datastore_emulator.py:187] shutting down the emulator running at http://localhost:15383

OSError: dlopen(/private/var/folders/59/gg2vm1h52x7fz0254tg9x29c0000gn/T/tmpjI55tQ/lib/python3.7/site-packages/lightgbm/lib_lightgbm.so, 6): Library not loaded: /usr/local/opt/libomp/lib/libomp.dylib
  Referenced from: /private/var/folders/59/gg2vm1h52x7fz0254tg9x29c0000gn/T/tmpjI55tQ/lib/python3.7/site-packages/lightgbm/lib_lightgbm.so
  Reason: image not found
みたいなエラーが出る時がある。
$ pip install lightgbm自体は問題ないので、Clang系のライブラリ依存を解決しないといけない。
$ brew install libomp通常は上記のインストールでうまくいく。
- 投稿日:2019-08-30T13:15:18+09:00
LightGBMをimportできない場合
Macで機械学習しているときにLightGBMを使おうとすると
[2019-08-30 13:08:07,214] ERROR in app: Exception on / [GET]
Traceback (most recent call last):
  File "/private/var/folders/59/gg2vm1h52x7fz0254tg9x29c0000gn/T/tmpjI55tQ/lib/python3.7/site-packages/flask/app.py", line 2292, in wsgi_app
    response = self.full_dispatch_request()
  File "/private/var/folders/59/gg2vm1h52x7fz0254tg9x29c0000gn/T/tmpjI55tQ/lib/python3.7/site-packages/flask/app.py", line 1815, in full_dispatch_request
    rv = self.handle_user_exception(e)
  File "/private/var/folders/59/gg2vm1h52x7fz0254tg9x29c0000gn/T/tmpjI55tQ/lib/python3.7/site-packages/flask/app.py", line 1718, in handle_user_exception
    reraise(exc_type, exc_value, tb)
  File "/private/var/folders/59/gg2vm1h52x7fz0254tg9x29c0000gn/T/tmpjI55tQ/lib/python3.7/site-packages/flask/_compat.py", line 35, in reraise
    raise value
  File "/private/var/folders/59/gg2vm1h52x7fz0254tg9x29c0000gn/T/tmpjI55tQ/lib/python3.7/site-packages/flask/app.py", line 1813, in full_dispatch_request
    rv = self.dispatch_request()
  File "/private/var/folders/59/gg2vm1h52x7fz0254tg9x29c0000gn/T/tmpjI55tQ/lib/python3.7/site-packages/flask/app.py", line 1799, in dispatch_request
    return self.view_functions[rule.endpoint](**req.view_args)
  File "/private/var/folders/59/gg2vm1h52x7fz0254tg9x29c0000gn/T/tmpjI55tQ/lib/python3.7/site-packages/lightgbm/__init__.py", line 8, in <module>
    from .basic import Booster, Dataset
  File "/private/var/folders/59/gg2vm1h52x7fz0254tg9x29c0000gn/T/tmpjI55tQ/lib/python3.7/site-packages/lightgbm/basic.py", line 34, in <module>
    _LIB = _load_lib()
  File "/private/var/folders/59/gg2vm1h52x7fz0254tg9x29c0000gn/T/tmpjI55tQ/lib/python3.7/site-packages/lightgbm/basic.py", line 29, in _load_lib
    lib = ctypes.cdll.LoadLibrary(lib_path[0])
  File "/usr/local/Cellar/python/3.7.4/Frameworks/Python.framework/Versions/3.7/lib/python3.7/ctypes/__init__.py", line 442, in LoadLibrary
INFO     2019-08-30 04:08:07,234 module.py:861] default: "GET / HTTP/1.1" 500 290
    return self._dlltype(name)
  File "/usr/local/Cellar/python/3.7.4/Frameworks/Python.framework/Versions/3.7/lib/python3.7/ctypes/__init__.py", line 364, in __init__
    self._handle = _dlopen(self._name, mode)
OSError: dlopen(/private/var/folders/59/gg2vm1h52x7fz0254tg9x29c0000gn/T/tmpjI55tQ/lib/python3.7/site-packages/lightgbm/lib_lightgbm.so, 6): Library not loaded: /usr/local/opt/libomp/lib/libomp.dylib
  Referenced from: /private/var/folders/59/gg2vm1h52x7fz0254tg9x29c0000gn/T/tmpjI55tQ/lib/python3.7/site-packages/lightgbm/lib_lightgbm.so
  Reason: image not found
^CINFO     2019-08-30 04:08:26,325 datastore_emulator.py:187] shutting down the emulator running at http://localhost:15383

OSError: dlopen(/private/var/folders/59/gg2vm1h52x7fz0254tg9x29c0000gn/T/tmpjI55tQ/lib/python3.7/site-packages/lightgbm/lib_lightgbm.so, 6): Library not loaded: /usr/local/opt/libomp/lib/libomp.dylib
  Referenced from: /private/var/folders/59/gg2vm1h52x7fz0254tg9x29c0000gn/T/tmpjI55tQ/lib/python3.7/site-packages/lightgbm/lib_lightgbm.so
  Reason: image not found
みたいなエラーが出る時がある。
$ pip install lightgbm自体は問題ないので、Clang系のライブラリ依存を解決しないといけない。
$ brew install libomp通常は上記のインストールで解決する。
- 投稿日:2019-08-30T10:20:02+09:00
[はじめてのRDBOX(5)]rdbox使ってみました:ROS Publisher編
はじめに
ROS の初心者が、とっても簡単なROSアプリを作ってみました。(連載記事です)
今回の記事の概要
- 以前の記事で定義したメッセージを使い、撮影した画像ファイルを配信(Publish)する ROS アプリを構築する
- 作成したソースファイルを GitHub に登録する
- 今回の記事に該当するソースファイルは、以下のアドレスから参照可能です
事前準備
- 今回の ROS アプリは、Raspberry PI のカメラを制御するため、Raspbian OS 環境で稼働することを想定しています
- ROS 環境を構築する場合は、@dyson8910 さんの記事「Raspberry Pi 3 にROS kinetic をインストールしてみました。」が参考になりました
- 最終的に(次回以降の記事で)は、RDBOX 環境にて Dockerコンテナ(raspbian)で動かします
- 今回の記事では、実際に環境構築せず雰囲気を感じてもらうだけでも十分です
構築
関連パッケージ
- 画像データ取り扱いに関連して OpenCV を使用している
$ sudo apt install -y python-opencv ros-melodic-cv-bridgeGitHub から clone
- GitHub から clone します
- 以前の記事「[はじめてのRDBOX(3)]rdbox使ってみました:ROSパッケージ作成編」などで作成(commit)したファイル一式を GitHub 経由で取得(※GitHub便利です!!)
  $ mkdir -p ${HOME}/ros_ws/src
  $ cd ${HOME}/ros_ws/src
  $ git clone https://github.com/YourGitHubAccount/picam_ros.git
  $ ls -lR picam_ros      # msg/picam_photo.msg などが取得できているはずです
scripts/take_pub_photo.py
- 今回の記事のアプリソースファイルの作成
- 以下(↓)は具体的な手順(下記例では、GitHubよりファイルを取得)
  $ mkdir -p ${HOME}/ros_ws/src/picam_ros/scripts
  $ cd ${HOME}/ros_ws/src/picam_ros/scripts
  $ curl -s -o take_pub_photo.py https://raw.githubusercontent.com/higuchi-toshio-intec/example-picam/master/picam_ros/scripts/take_pub_photo.py
  $ chmod +x take_pub_photo.py
ソースファイルの主要部分説明
- 静止画撮影
- Rapbian OS の raspistill コマンドを実行
- 今日の日付文字列を含んだファイル名
- サブプロセスでコマンド実行(画像撮影)
- 以下(↓)は対応する部分
        #
        filename = "%s/photo-%s.jpeg" % (dir_tmp, today.strftime("%Y%m%dT%H%M%S"), )
        cmd = "raspistill -w %d -h %d -o %s" % (args.w, args.h, filename)
        subprocess.call(cmd, shell=True)
- Publisherの生成
- トピック名称:example_picam_photo
- データ型:picam_photo
- キューサイズ:100
- latch:True
- True を設定することで Publisher と Subscriber 間でのデータ受け渡しがうまくできたため
- False でもよかったかもしれない
- 以下(↓)は対応する部分
  def create_pub(node_name):
    rospy.init_node(MyNodeName, anonymous=True)
    staLatch = True
    pub = rospy.Publisher('example_picam_photo', picam_photo, queue_size=100, latch=staLatch)

    return pub
- 配信(Publish)
- Publish 頻度に合わせて rate を設定(1秒当たりの回数)
- 今回の記事のようなケースでは、もっと小さな値でも OK
- データ型 picam_photo の変数(msg)を作成し以下の情報を格納
- 現在時刻
- 端末ID
- 画像データ(OpenCV を使用し読み込み)
- 以下(↓)は対応する部分
  def pub_photo(pub, file_photo):

    #
    pub_rate = rospy.Rate(30)

    #
    msg = picam_photo()

    #
    print("[INFO] reading... " + file_photo)
    photo_cv2 = cv2.imread(file_photo, cv2.IMREAD_COLOR)

    #
    msg.timestamp = rospy.Time.now()
    msg.edge_id = MyNodeName

    #
    msg.picam_photo = GV_cv_bridge.cv2_to_imgmsg(photo_cv2)

    #
    pub.publish(msg)
    pub_rate.sleep()
GitHub への登録
- 作成したファイル全てを GitHub に登録
- 以下(↓)は具体的な手順
  $ cd ${HOME}/ros_ws/src/picam_ros
  $ git add .
  $ git commit -m 'CommitMessage'
  $ git push
catkin_make
コンパイル実行
- 実行コマンドは catkin_make
- 「catkin_make: command not found」となった場合は、以下のコマンドを実行
$ source /opt/ros/${ROS_DISTRO}/setup.bash以下(↓)は具体的な手順
$ cd ${HOME}/ros_ws/
$ catkin_make
アプリ起動
- 以下(↓)は具体的な手順
$ cd ${HOME}/ros_ws
$ source /opt/ros/${ROS_DISTRO}/setup.bash
$ source devel/setup.bash
$ rosrun picam_ros take_pub_photo.py
記事リスト(予定)
- 概要編
- 画像参照アプリの構築編
- ROSパッケージ作成編
- ROS Subscriber編
- ROS Publisher編(← 今回の記事)
- DockerImage 作成編
- RDBOX(k8s) ポート転送編
- RDBOX(k8s) Subscriber アプリ編
- RDBOX(k8s) Publisher アプリ編
- 雑記
- 投稿日:2019-08-30T10:12:23+09:00
PyCharmを使ってdocker-composeのinterpreter上でDjangoのカスタムコマンドをデバッグする
やりたいこと
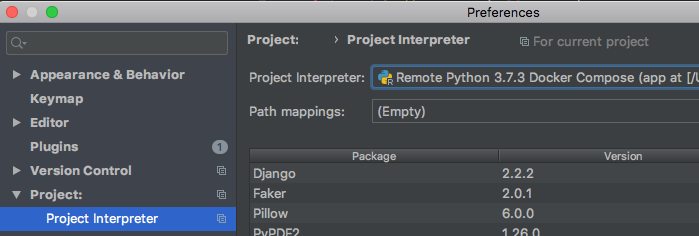
- PyCharm上でdocker-composeをinterpreterに指定している状態で、
そのコンテナ内でDjangoのカスタムコマンドを起動してブレークポイントなどのデバッグをしたい前提
- Docker Composeで構築されるコンテナがInterpreterに指定されていること。
手順
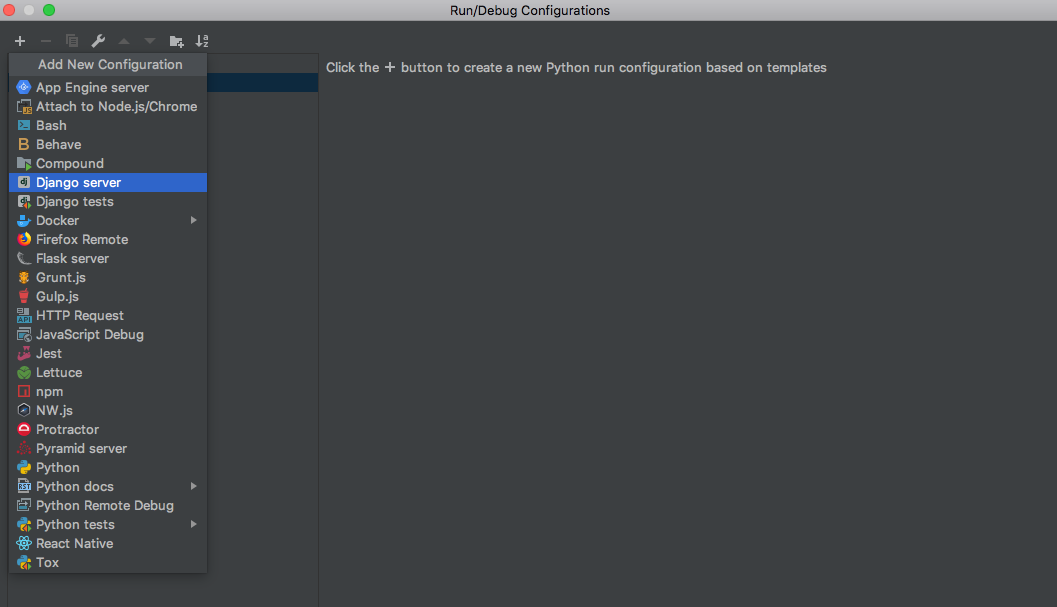
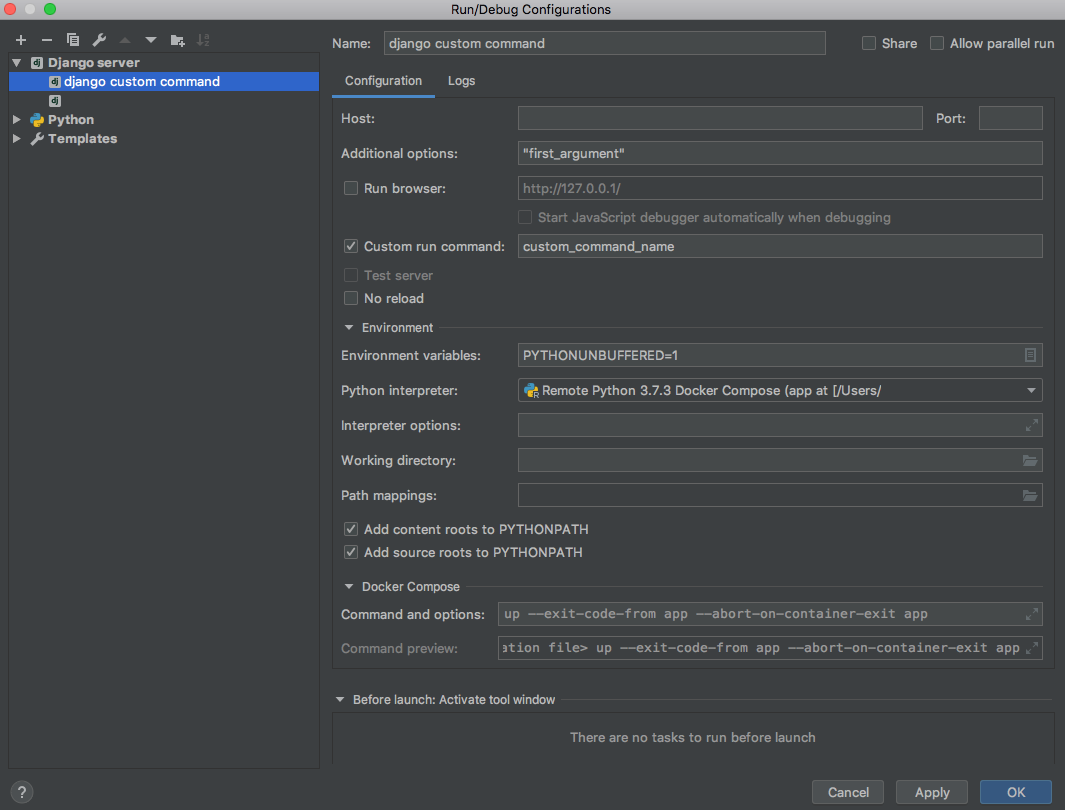
[Run / Debug Configuration]に設定を追加します。
[Edit Configurations...]を選択して、[Run / Debug Configuration]の設定画面を開きます。- 左上の + ボタンから
[Add New Configuration]のリストを開き、Django serverを選択します。
- 以下のように、
Custom run command:に実行したいコマンド名を入れます。- コマンドに渡す引数があれば、
Additional options:に追加します。- HostやPortは環境に合わせて設定してください。 (私の環境下だとどちらも空で問題ありませんでした。)
- ここまで設定できたら、
Applyしてデバッグ実行することで、通常のrun_serverと同様にブレークポイントで止めたりといったデバッグが可能になります
- 投稿日:2019-08-30T09:42:09+09:00
FlaskでWSGIラインプロファイラ(wsgi_lineprof)を使う
PythonのWebアプリケーションで汎用的に使えるプロファイラを探していた所、wsgi_lineprofが良さそうだったのでFlaskアプリで使用した例を共有させて頂きます。
背景
先日社内ISUCONが開催されまして、ISUCON無知だったのですがとりあえずPython勢として参加してみました。
結果はあまり振るわなかったのですが、特にプロファイリングすら出来なかったことがずっと心残りだったため、今回調べてみたという流れです。wsgi_lineprof
PythonのWSGI ミドルウェアとして使えるラインプロファイラで、Django,Pyramid,Flask,Bottle などのWSGI互換のアプリケーションやフレームワークと組み合わせて利用できるとのこと。ちなみにPyCon2017のLTで発表されたもののようです。
WSGI ミドルウェアとして使えるラインプロファイラを作った話早速使ってみる
ということで早速使ってみます。
使用するプログラムは先日会社のテックブログに投稿させていただいたベイズロジスティック回帰のコードを流用しています。import jinja2 import flask import math import numpy as np import sys from scipy.stats import bernoulli from wsgi_lineprof.middleware import LineProfilerMiddleware from wsgi_lineprof.filters import FilenameFilter, TotalTimeSorter LAYOUT = """ <html> <title>Guestbook</title> <body> <ul> {% for entry in entries %} <li><h2>{{ entry.name }}</h2> {{ entry.value }} </li> {% endfor %} </ul> </body> </html> """ np.random.seed(1234) # xの次元数 M = 2 # xのデータ数 N = 25 # 変分パラメータの学習率 alpha = 1.0e-4 # 変分推論の繰り返し回数 max_iter = 1000 def sigmoid(a): s = 1 / (1 + math.exp(-a)) return s # 変分推論 def VI(Y, X, M, Sigma_w, alpha, max_iter): def rho2sig(rho): return np.log(1 + np.exp(rho)) def calc_d_mu(Y, X, Sigma_w_inv, mu, rho, W): # 第一項は0なため不要 term2 = np.dot(Sigma_w_inv, W) term3 = 0 W_tr = W.T term3 = sum([ -(Y[i] - sigmoid(np.dot(W_tr, X[:, i]))) * X[:, i] for i in range(n)]) return term2 + term3 # diag gaussian for approximate posterior m, n = X.shape mu = np.random.randn(m) rho = np.random.randn(m) Sigma_w_inv = np.linalg.inv(Sigma_w) for i in range(max_iter): # sample epsilon ep = np.random.randn(m) W_tmp = mu + rho2sig(rho) * ep # calculate gradient d_mu = calc_d_mu(Y, X, Sigma_w_inv, mu, rho, W_tmp) d_rho = ((d_mu * ep) - (1 / rho2sig(rho))) * (1 / (1+np.exp(-rho))) # update variational parameters mu = mu - alpha * d_mu rho = rho - alpha * d_rho return mu, rho app = flask.Flask('bayesian-logistic-regression') @app.route('/') def vi(): # xの事前分布の共分散行列Σ Sigma_w = 100.0 * np.eye(M) X = 2 * np.random.rand(M, N) - 1.0 W_truth = np.random.multivariate_normal(np.zeros(M), Sigma_w) W_truth_tr = W_truth.T Y = np.array([bernoulli.rvs(sigmoid(np.dot(W_truth_tr, X[:, i]))) for i in range(N)]) mu, rho = VI(Y, X, M, Sigma_w, alpha, max_iter) entries = [{'name': 'mu', 'value': mu}, {'name': 'rho', 'value': rho}] return jinja2.Template(LAYOUT).render(entries=entries) if __name__ == '__main__': filters = [ FilenameFilter("test_app.py"), # このプロフラムファイル名です lambda stats: filter(lambda stat: stat.total_time > 0.0001, stats), ] app.config['PROFILE'] = True with open("lineprof.log", "w") as f: app.wsgi_app = LineProfilerMiddleware(app.wsgi_app, stream=f, filters=filters) app.run(host='0.0.0.0', port=5000)上記のコードを
test_app.pyとして、
python3 test_app.pyでFlaskを立ち上げて、ブラウザでhttp://localhost:5000/にアクセスすると以下の結果が得られました。wsgi_lineprofの結果ファイルは以下のようになっています。
Time unit: 1e-09 [sec]

File: test_app.py
Name: vi
Total time: 0.437176 [sec]
  Line      Hits         Time  Per Hit  % Time  Code
====================================================
    85                                          @app.route('/')
    86                                          def vi():
    87                                              # xの事前分布の共分散行列Σ
    88         1        42667  42667.0     0.0      Sigma_w = 100.0 * np.eye(M)
    89         1        37846  37846.0     0.0      X = 2 * np.random.rand(M, N) - 1.0
    90         1       953424 953424.0     0.2      W_truth = np.random.multivariate_normal(np.zeros(M), Sigma_w)
    91         1         1457   1457.0     0.0      W_truth_tr = W_truth.T
    92         1      6082760 6082760.0     1.4      Y = np.array([bernoulli.rvs(sigmoid(np.dot(W_truth_tr, X[:, i]))) for i in range(N)])
    93         1    394951989 394951989.0    90.3      mu, rho = VI(Y, X, M, Sigma_w, alpha, max_iter)
    94
    95         1         1169   1169.0     0.0      entries = [{'name': 'mu', 'value': mu}, {'name': 'rho', 'value': rho}]
    96         1     35104474 35104474.0     8.0      return jinja2.Template(LAYOUT).render(entries=entries)

File: test_app.py
Name: <listcomp>
Total time: 0.00604374 [sec]
  Line      Hits         Time  Per Hit  % Time  Code
====================================================
    92        26      6043742 232451.6   100.0      Y = np.array([bernoulli.rvs(sigmoid(np.dot(W_truth_tr, X[:, i]))) for i in range(N)])
    93                                              mu, rho = VI(Y, X, M, Sigma_w, alpha, max_iter)
    94
    95                                              entries = [{'name': 'mu', 'value': mu}, {'name': 'rho', 'value': rho}]
    96                                              return jinja2.Template(LAYOUT).render(entries=entries)
    97
    98
    99                                          if __name__ == '__main__':
   100                                              filters = [
   101                                                  FilenameFilter("test_app.py"),
   102                                                  lambda stats: filter(lambda stat: stat.total_time > 0.0001, stats),
   103                                              ]

File: test_app.py
Name: sigmoid
Total time: 0.0231688 [sec]
  Line      Hits         Time  Per Hit  % Time  Code
====================================================
    41                                          def sigmoid(a):
    42     25025     17901666    715.4    77.3      s = 1 / (1 + math.exp(-a))
    43     25025      5267177    210.5    22.7      return s

File: test_app.py
Name: VI
Total time: 0.385176 [sec]
  Line      Hits         Time  Per Hit  % Time  Code
====================================================
    46                                          def VI(Y, X, M, Sigma_w, alpha, max_iter):
    47
    48         1          833    833.0     0.0      def rho2sig(rho):
    49                                                  return np.log(1 + np.exp(rho))
    50
    51         1          832    832.0     0.0      def calc_d_mu(Y, X, Sigma_w_inv, mu, rho, W):
    52                                                  # 第一項は0なため不要
    53                                                  term2 = np.dot(Sigma_w_inv, W)
    54                                                  term3 = 0
    55                                                  W_tr = W.T
    56                                                  term3 = sum([ -(Y[i] - sigmoid(np.dot(W_tr, X[:, i]))) * X[:, i] for i in range(n)])
    57
    58                                                  return term2 + term3
    59
    60                                              # diag gaussian for approximate posterior
    61         1         1316   1316.0     0.0      m, n = X.shape
    62         1        25150  25150.0     0.0      mu = np.random.randn(m)
    63         1         2371   2371.0     0.0      rho = np.random.randn(m)
    64         1       228259 228259.0     0.1      Sigma_w_inv = np.linalg.inv(Sigma_w)
    65
    66      1001       599453    598.9     0.2      for i in range(max_iter):
    67                                                  # sample epsilon
    68      1000      3516197   3516.2     0.9          ep = np.random.randn(m)
    69      1000      5893163   5893.2     1.5          W_tmp = mu + rho2sig(rho) * ep
    70
    71                                                  # calculate gradient
    72      1000    358329384 358329.4    93.0          d_mu = calc_d_mu(Y, X, Sigma_w_inv, mu, rho, W_tmp)
    73      1000     12519616  12519.6     3.3          d_rho = ((d_mu * ep) - (1 / rho2sig(rho))) * (1 / (1+np.exp(-rho)))
    74
    75                                                  # update variational parameters
    76      1000      2239694   2239.7     0.6          mu = mu - alpha * d_mu
    77      1000      1819522   1819.5     0.5          rho = rho - alpha * d_rho
    78
    79         1          471    471.0     0.0      return mu, rho

File: test_app.py
Name: rho2sig
Total time: 0.00702795 [sec]
  Line      Hits         Time  Per Hit  % Time  Code
====================================================
    48                                              def rho2sig(rho):
    49      2000      7027949   3514.0   100.0          return np.log(1 + np.exp(rho))

File: test_app.py
Name: calc_d_mu
Total time: 0.351921 [sec]
  Line      Hits         Time  Per Hit  % Time  Code
====================================================
    51                                              def calc_d_mu(Y, X, Sigma_w_inv, mu, rho, W):
    52                                                  # 第一項は0なため不要
    53      1000      5815585   5815.6     1.7          term2 = np.dot(Sigma_w_inv, W)
    54      1000       339332    339.3     0.1          term3 = 0
    55      1000       686803    686.8     0.2          W_tr = W.T
    56      1000    344064367 344064.4    97.8          term3 = sum([ -(Y[i] - sigmoid(np.dot(W_tr, X[:, i]))) * X[:, i] for i in range(n)])
    57
    58      1000      1015033   1015.0     0.3          return term2 + term3

File: test_app.py
Name: <listcomp>
Total time: 0.313714 [sec]
  Line      Hits         Time  Per Hit  % Time  Code
====================================================
    56     26000    313714155  12065.9   100.0          term3 = sum([ -(Y[i] - sigmoid(np.dot(W_tr, X[:, i]))) * X[:, i] for i in range(n)])
概ね期待する結果が得られたと思います。逆行列の取得処理が遅いなぁといったことがわかりますね!
その他のプロファイラについて
実は本記事を書くにあたり様々なプロファイラを試してみて、結果wsgi_lineprofが一番良かったかなという感じでした。自身の備忘録もかねて、他プロファイラを使った感想を記載いたします。(ラインプロファイラに限らず良さげなものを探していました)
- cProfile
- Pythonの標準モジュールであり、手軽に使える
- 結果をファイルに書き出せば
snakevizを使って簡単に可視化できる- 結果をフィルタする方法がわからず断念。(普通に使うFlaskパッケージのファイル等が大量に出力されてしまう…)
- before_request, after_request等でうまくフックできるかと思ったけど、うまくいかなかった。
- pyflame
- uberが作っているプロファイラ
- Dockerでセットアップして使ってみた所、
Unexpected ptrace(2) exception: Failed to PTRACE_PEEKDATA (pid XXXX, addr 0x7f87d33ce030): Input/output errorのエラーが大量に出て修正できず断念。- install自体は公式や色々な人のDockerfileを参考にしてうまくいってるはずなのだが…。
- py-spy
- pipで手軽にインストール可能で、実行中のPython(Flask)のPIDを指定すればさくっとプロファイリングできた。
- ボトルネックにさくっとあたりを付けるのによさそう。
- 可視化する場合、svgファイルに書き出すので検索性に厳しいものがあると感じた。
- vprof
- 可視化がリッチで良さげ。
- 純粋なPythonスクリプトの実行では期待する結果が得られた。
- Flaskで実行する方法がわからず断念。
- 公式にFlaskのサンプルがあるが、
signal only works in main threadというエラーが出て動かない…。- Flask-profiler
- 公式リポジトリのプロファイリング結果サンプルをみて これが欲しかった!ってなった。
- インストール&導入も簡単にできた。
- しかし、元々ISUCON出発で調べ始めていたので、Flaskにロックされるのはどうなの…?と思ってちょっと触って終わった。
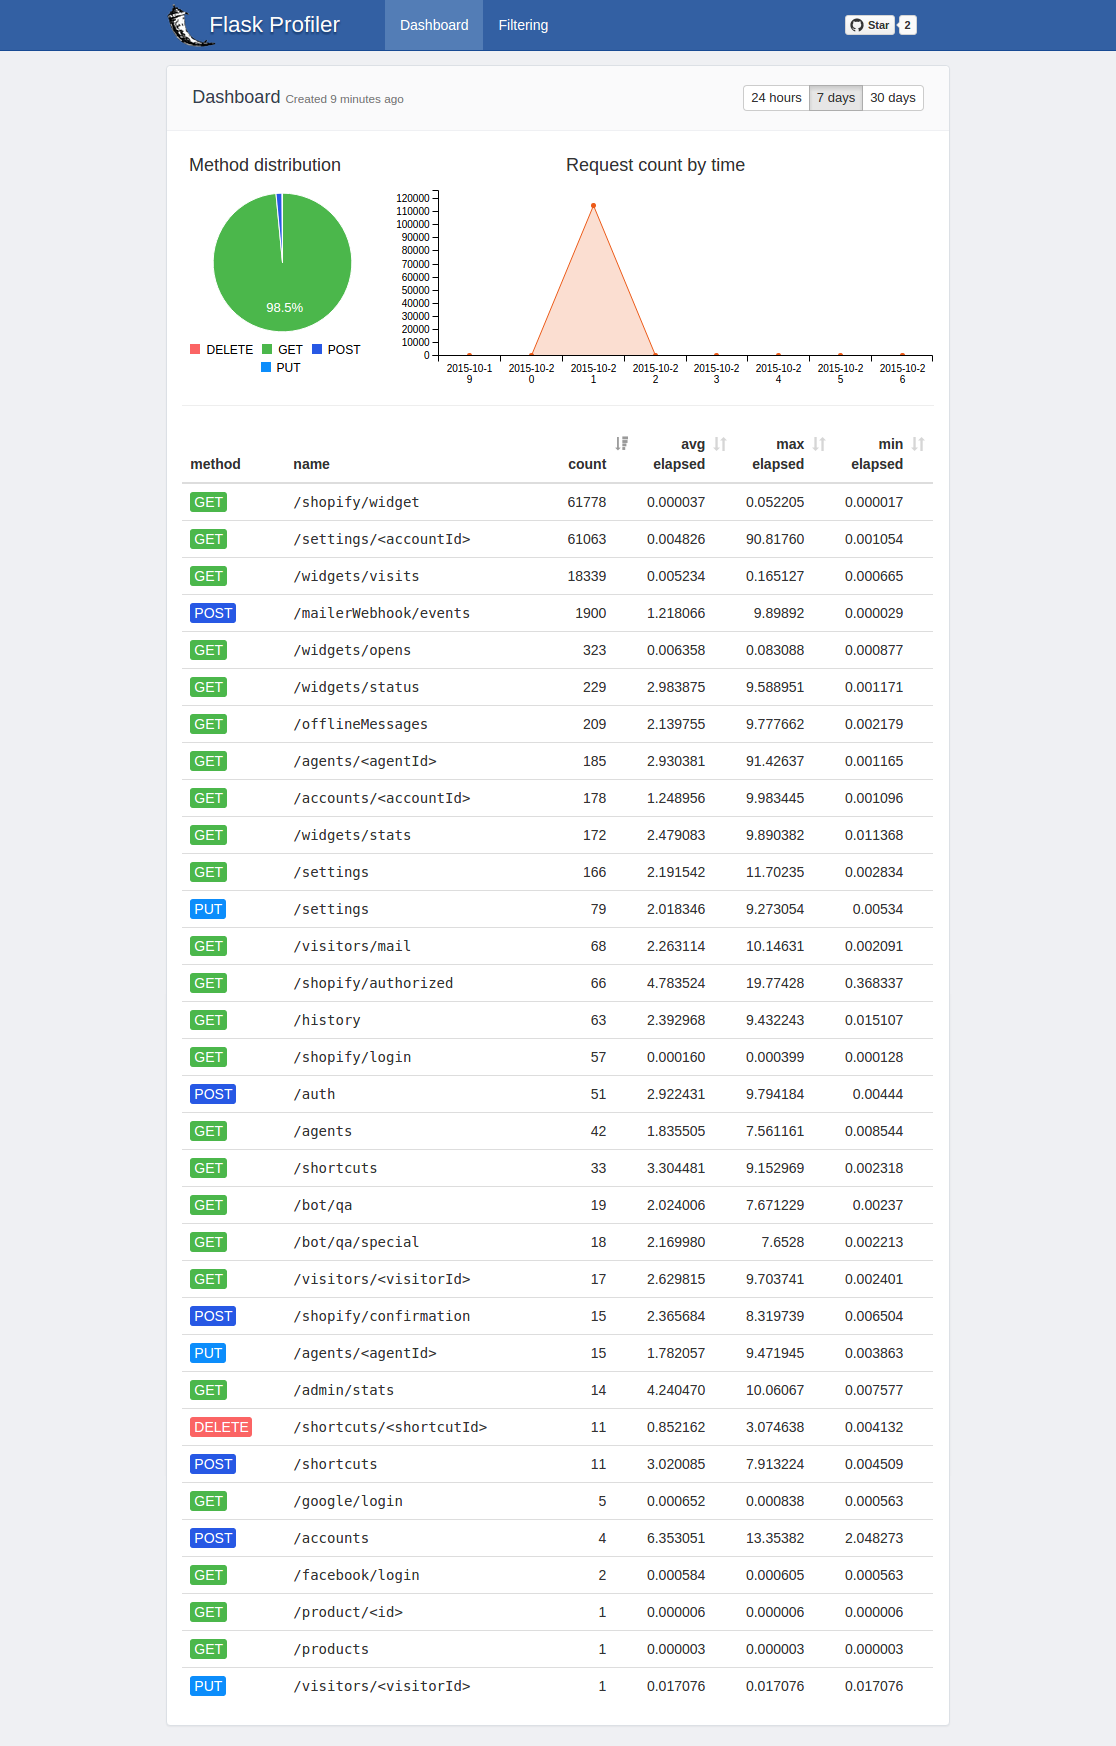
参考にさせていただいたサイト
- 投稿日:2019-08-30T09:42:09+09:00
Pythonパフォーマンスチューニング:FlaskでWSGIラインプロファイラ(wsgi_lineprof)を使う
PythonのWebアプリケーションで汎用的に使えるプロファイラを探していた所、wsgi_lineprofが良さそうだったのでFlaskアプリで使用した例を共有させて頂きます。
背景
先日社内ISUCONが開催されまして、ISUCON無知だったのですがとりあえずPython勢として参加してみました。
結果はあまり振るわなかったのですが、特にプロファイリングすら出来なかったことがずっと心残りだったため、今回調べてみたという流れです。wsgi_lineprof
PythonのWSGI ミドルウェアとして使えるラインプロファイラで、Django,Pyramid,Flask,Bottle などのWSGI互換のアプリケーションやフレームワークと組み合わせて利用できるとのこと。ちなみにPyCon2017のLTで発表されたもののようです。
WSGI ミドルウェアとして使えるラインプロファイラを作った話早速使ってみる
ということで早速使ってみます。
使用するプログラムは先日会社のテックブログに投稿させていただいたベイズロジスティック回帰のコードを流用しています。import jinja2 import flask import math import numpy as np import sys from scipy.stats import bernoulli from wsgi_lineprof.middleware import LineProfilerMiddleware from wsgi_lineprof.filters import FilenameFilter, TotalTimeSorter LAYOUT = """ <html> <title>Guestbook</title> <body> <ul> {% for entry in entries %} <li><h2>{{ entry.name }}</h2> {{ entry.value }} </li> {% endfor %} </ul> </body> </html> """ np.random.seed(1234) # xの次元数 M = 2 # xのデータ数 N = 25 # 変分パラメータの学習率 alpha = 1.0e-4 # 変分推論の繰り返し回数 max_iter = 1000 def sigmoid(a): s = 1 / (1 + math.exp(-a)) return s # 変分推論 def VI(Y, X, M, Sigma_w, alpha, max_iter): def rho2sig(rho): return np.log(1 + np.exp(rho)) def calc_d_mu(Y, X, Sigma_w_inv, mu, rho, W): # 第一項は0なため不要 term2 = np.dot(Sigma_w_inv, W) term3 = 0 W_tr = W.T term3 = sum([ -(Y[i] - sigmoid(np.dot(W_tr, X[:, i]))) * X[:, i] for i in range(n)]) return term2 + term3 # diag gaussian for approximate posterior m, n = X.shape mu = np.random.randn(m) rho = np.random.randn(m) Sigma_w_inv = np.linalg.inv(Sigma_w) for i in range(max_iter): # sample epsilon ep = np.random.randn(m) W_tmp = mu + rho2sig(rho) * ep # calculate gradient d_mu = calc_d_mu(Y, X, Sigma_w_inv, mu, rho, W_tmp) d_rho = ((d_mu * ep) - (1 / rho2sig(rho))) * (1 / (1+np.exp(-rho))) # update variational parameters mu = mu - alpha * d_mu rho = rho - alpha * d_rho return mu, rho app = flask.Flask('bayesian-logistic-regression') @app.route('/') def vi(): # xの事前分布の共分散行列Σ Sigma_w = 100.0 * np.eye(M) X = 2 * np.random.rand(M, N) - 1.0 W_truth = np.random.multivariate_normal(np.zeros(M), Sigma_w) W_truth_tr = W_truth.T Y = np.array([bernoulli.rvs(sigmoid(np.dot(W_truth_tr, X[:, i]))) for i in range(N)]) mu, rho = VI(Y, X, M, Sigma_w, alpha, max_iter) entries = [{'name': 'mu', 'value': mu}, {'name': 'rho', 'value': rho}] return jinja2.Template(LAYOUT).render(entries=entries) if __name__ == '__main__': filters = [ FilenameFilter("test_app.py"), # このプロフラムファイル名です lambda stats: filter(lambda stat: stat.total_time > 0.0001, stats), ] app.config['PROFILE'] = True with open("lineprof.log", "w") as f: app.wsgi_app = LineProfilerMiddleware(app.wsgi_app, stream=f, filters=filters) app.run(host='0.0.0.0', port=5000)上記のコードを
test_app.pyとして、
python3 test_app.pyでFlaskを立ち上げて、ブラウザでhttp://localhost:5000/にアクセスすると以下の結果が得られました。wsgi_lineprofの結果ファイルは以下のようになっています。
Time unit: 1e-09 [sec]

File: test_app.py
Name: vi
Total time: 0.437176 [sec]
  Line      Hits         Time  Per Hit  % Time  Code
====================================================
    85                                          @app.route('/')
    86                                          def vi():
    87                                              # xの事前分布の共分散行列Σ
    88         1        42667  42667.0     0.0      Sigma_w = 100.0 * np.eye(M)
    89         1        37846  37846.0     0.0      X = 2 * np.random.rand(M, N) - 1.0
    90         1       953424 953424.0     0.2      W_truth = np.random.multivariate_normal(np.zeros(M), Sigma_w)
    91         1         1457   1457.0     0.0      W_truth_tr = W_truth.T
    92         1      6082760 6082760.0     1.4      Y = np.array([bernoulli.rvs(sigmoid(np.dot(W_truth_tr, X[:, i]))) for i in range(N)])
    93         1    394951989 394951989.0    90.3      mu, rho = VI(Y, X, M, Sigma_w, alpha, max_iter)
    94
    95         1         1169   1169.0     0.0      entries = [{'name': 'mu', 'value': mu}, {'name': 'rho', 'value': rho}]
    96         1     35104474 35104474.0     8.0      return jinja2.Template(LAYOUT).render(entries=entries)

File: test_app.py
Name: <listcomp>
Total time: 0.00604374 [sec]
  Line      Hits         Time  Per Hit  % Time  Code
====================================================
    92        26      6043742 232451.6   100.0      Y = np.array([bernoulli.rvs(sigmoid(np.dot(W_truth_tr, X[:, i]))) for i in range(N)])
    93                                              mu, rho = VI(Y, X, M, Sigma_w, alpha, max_iter)
    94
    95                                              entries = [{'name': 'mu', 'value': mu}, {'name': 'rho', 'value': rho}]
    96                                              return jinja2.Template(LAYOUT).render(entries=entries)
    97
    98
    99                                          if __name__ == '__main__':
   100                                              filters = [
   101                                                  FilenameFilter("test_app.py"),
   102                                                  lambda stats: filter(lambda stat: stat.total_time > 0.0001, stats),
   103                                              ]

File: test_app.py
Name: sigmoid
Total time: 0.0231688 [sec]
  Line      Hits         Time  Per Hit  % Time  Code
====================================================
    41                                          def sigmoid(a):
    42     25025     17901666    715.4    77.3      s = 1 / (1 + math.exp(-a))
    43     25025      5267177    210.5    22.7      return s

File: test_app.py
Name: VI
Total time: 0.385176 [sec]
  Line      Hits         Time  Per Hit  % Time  Code
====================================================
    46                                          def VI(Y, X, M, Sigma_w, alpha, max_iter):
    47
    48         1          833    833.0     0.0      def rho2sig(rho):
    49                                                  return np.log(1 + np.exp(rho))
    50
    51         1          832    832.0     0.0      def calc_d_mu(Y, X, Sigma_w_inv, mu, rho, W):
    52                                                  # 第一項は0なため不要
    53                                                  term2 = np.dot(Sigma_w_inv, W)
    54                                                  term3 = 0
    55                                                  W_tr = W.T
    56                                                  term3 = sum([ -(Y[i] - sigmoid(np.dot(W_tr, X[:, i]))) * X[:, i] for i in range(n)])
    57
    58                                                  return term2 + term3
    59
    60                                              # diag gaussian for approximate posterior
    61         1         1316   1316.0     0.0      m, n = X.shape
    62         1        25150  25150.0     0.0      mu = np.random.randn(m)
    63         1         2371   2371.0     0.0      rho = np.random.randn(m)
    64         1       228259 228259.0     0.1      Sigma_w_inv = np.linalg.inv(Sigma_w)
    65
    66      1001       599453    598.9     0.2      for i in range(max_iter):
    67                                                  # sample epsilon
    68      1000      3516197   3516.2     0.9          ep = np.random.randn(m)
    69      1000      5893163   5893.2     1.5          W_tmp = mu + rho2sig(rho) * ep
    70
    71                                                  # calculate gradient
    72      1000    358329384 358329.4    93.0          d_mu = calc_d_mu(Y, X, Sigma_w_inv, mu, rho, W_tmp)
    73      1000     12519616  12519.6     3.3          d_rho = ((d_mu * ep) - (1 / rho2sig(rho))) * (1 / (1+np.exp(-rho)))
    74
    75                                                  # update variational parameters
    76      1000      2239694   2239.7     0.6          mu = mu - alpha * d_mu
    77      1000      1819522   1819.5     0.5          rho = rho - alpha * d_rho
    78
    79         1          471    471.0     0.0      return mu, rho

File: test_app.py
Name: rho2sig
Total time: 0.00702795 [sec]
  Line      Hits         Time  Per Hit  % Time  Code
====================================================
    48                                              def rho2sig(rho):
    49      2000      7027949   3514.0   100.0          return np.log(1 + np.exp(rho))

File: test_app.py
Name: calc_d_mu
Total time: 0.351921 [sec]
  Line      Hits         Time  Per Hit  % Time  Code
====================================================
    51                                              def calc_d_mu(Y, X, Sigma_w_inv, mu, rho, W):
    52                                                  # 第一項は0なため不要
    53      1000      5815585   5815.6     1.7          term2 = np.dot(Sigma_w_inv, W)
    54      1000       339332    339.3     0.1          term3 = 0
    55      1000       686803    686.8     0.2          W_tr = W.T
    56      1000    344064367 344064.4    97.8          term3 = sum([ -(Y[i] - sigmoid(np.dot(W_tr, X[:, i]))) * X[:, i] for i in range(n)])
    57
    58      1000      1015033   1015.0     0.3          return term2 + term3

File: test_app.py
Name: <listcomp>
Total time: 0.313714 [sec]
  Line      Hits         Time  Per Hit  % Time  Code
====================================================
    56     26000    313714155  12065.9   100.0          term3 = sum([ -(Y[i] - sigmoid(np.dot(W_tr, X[:, i]))) * X[:, i] for i in range(n)])
概ね期待する結果が得られたと思います。逆行列の取得処理が遅いなぁといったことがわかりますね!
その他のプロファイラについて
実は本記事を書くにあたり様々なプロファイラを試してみて、結果wsgi_lineprofが一番良かったかなという感じでした。自身の備忘録もかねて、他プロファイラを使った感想を記載いたします。(ラインプロファイラに限らず良さげなものを探していました)
- cProfile
- Pythonの標準モジュールであり、手軽に使える
- 結果をファイルに書き出せば
snakevizを使って簡単に可視化できる- 結果をフィルタする方法がわからず断念。(普通に使うFlaskパッケージのファイル等が大量に出力されてしまう…)
- before_request, after_request等でうまくフックできるかと思ったけど、うまくいかなかった。
- pyflame
- uberが作っているプロファイラ
- Dockerでセットアップして使ってみた所、
Unexpected ptrace(2) exception: Failed to PTRACE_PEEKDATA (pid XXXX, addr 0x7f87d33ce030): Input/output errorのエラーが大量に出て修正できず断念。- install自体は公式や色々な人のDockerfileを参考にしてうまくいってるはずなのだが…。
- py-spy
- pipで手軽にインストール可能で、実行中のPython(Flask)のPIDを指定すればさくっとプロファイリングできた。
- ボトルネックにさくっとあたりを付けるのによさそう。
- 可視化する場合、svgファイルに書き出すので検索性に厳しいものがあると感じた。
- vprof
- 可視化がリッチで良さげ。
- 純粋なPythonスクリプトの実行では期待する結果が得られた。
- Flaskで実行する方法がわからず断念。
- 公式にFlaskのサンプルがあるが、
signal only works in main threadというエラーが出て動かない…。- Flask-profiler
- 公式リポジトリのプロファイリング結果サンプルをみて これが欲しかった!ってなった。
- インストール&導入も簡単にできた。
- しかし、元々ISUCON出発で調べ始めていたので、Flaskにロックされるのはどうなの…?と思ってちょっと触って終わった。

参考にさせていただいたサイト
- 投稿日:2019-08-30T09:05:34+09:00
Python+pytestでテスト駆動開発しようとしたらテストの実行で躓いたので解決法をメモ
業務でPythonによるテスト駆動開発(TDD)を行うことになり、pytestを用いました。ただ、ディレクトリ構造が正しく認識されないとModuleNotFoundErrorに阻まれて実装が進まなくなってしまうため、備忘録を兼ねてまとめることにしました。
環境構築
pytestのインストールが必要です。下記コマンドの実行でインストールが可能です。
pip install pytestpytestを毎回手動実行するのは煩雑であるため自動実行できる様にしておこうと思い、pytest-watchもインストールしました。起動しておくとソースが更新される毎に自動でpytestによるテストが実行されます。
pip intall pytest-watch起動方法
ptw最も簡単な方法
最も簡単な方法はソースファイルとテストソースを同じディレクトリ内に格納する方法です。これ以降、以下のサンプルソースを使って説明します。空ファイルに近い内容ですが、pytestが実行されているかの確認には使えます。
ソースファイル(hogehoge.py)
class HogeHoge:
    pass
テストソース(test_hogehoge.py)
from hogehoge import HogeHoge def test_init(): HogeHoge()pytestはtest_hogehoge.pyまたはhogehoge_test.pyというファイル名を探して実行される仕様となっているので必ずテストソースのファイル名にはtestの文言を含めましょう。別のターミナルをもう1つ起動しソースが格納されているディレクトリに移動した上でpytest-watchを起動してみましょう。pytestが実行されます。
正常にテストが完了するとこの様な表示が出ます
============================= test session starts ==============================
platform darwin -- Python 3.7.3, pytest-5.1.1, py-1.8.0, pluggy-0.12.0
rootdir: sample-tdd
collected 1 item
test_hogehoge.py .                                                       [100%]

============================== 1 passed in 0.01s ===============================
ソースディレクトリを切り分ける方法
ソースファイルが少ない時は上記の方法でも良いでしょう。しかし、ソースファイルが増えればソースファイルとテストソースが混在してしまい、目的のソースファイルが探しにくくなります。故にソース用ディレクトリとテスト用ディレクトリに切り分けます。
ディレクトリの切り分け
今回は以下の様なディレクトリ構造にしました。pytestはカレントディレクトリかtestsというディレクトリにテストを探しに行く仕様となっている様なので、testsというディレクトリ名にしています。
sample_tdd/
├── modules
│   └── hogehoge.py
└── tests
    └── test_hogehoge.py
__init__.pyの準備modulesディレクトリにinit.pyを格納します。記載内容は以下の通りです。
from .hogehoge import HogeHoge

__all__ = [

    'HogeHoge',

]
テストソースの修正
test_hogehoge.pyの内容を以下の様に修正します。
- from hogehoge import HogeHoge
+ from modules.hogehoge import HogeHoge

def test_init():
    HogeHoge()
結果として以下の様なディレクトリ構造になりました。
sample_tdd/
├── modules
│   ├── __init__.py
│   └── hogehoge.py
└── tests
    └── test_hogehoge.py
pytest-watchを実行すると以下の様な結果となりました。
______________ ERROR collecting sample_tdd/tests/test_hogehoge.py ______________
ImportError while importing test module 'sample_tdd/tests/test_hogehoge.py'.
Hint: make sure your test modules/packages have valid Python names.
Traceback:
sample_tdd/tests/test_hogehoge.py:1: in <module>
    from modules.hogehoge import HogeHoge
E   ModuleNotFoundError: No module named 'modules'
!!!!!!!!!!!!!!!!!!! Interrupted: 1 errors during collection !!!!!!!!!!!!!!!!!!!!
=============================== 1 error in 0.05s ==============================
conftest.pyを追加
プロジェクトのrootディレクトリ(この例ではsample_tddディレクトリ)に空ファイルconftest.pyを追加します。追加には以下のコマンドを実行します。これはpytestの仕様上必要なファイルです。
touch conftest.pyディレクトリ構造は以下の様になりました。
sample_tdd/
├── conftest.py
├── modules
│   ├── __init__.py
│   └── hogehoge.py
└── tests
    └── test_hogehoge.py
pytest-watchの実行結果が以下の様に変わり正常にテストが終了しました。
============================= test session starts ==============================
platform darwin -- Python 3.7.3, pytest-5.1.1, py-1.8.0, pluggy-0.12.0
rootdir: sample_tdd
collected 1 item

sample_tdd/tests/test_hogehoge.py .                                      [100%]

============================== 1 passed in 0.02s ===============================
まとめ
pytest、pytest-watchを使ってのPythonによるテスト駆動開発を実施するための前準備として環境構築を行い、簡単なサンプルプログラムを実行し、正しくテストが実施されることを確認しました。今回記載したpytestの仕様上の規則等についても今後随時追加していきたいと思います。
Reference
https://code-examples.net/ja/q/9c7602
https://qiita.com/ysk24ok/items/2711295d83218c699276
https://qiita.com/sasaki77/items/97c90ae272373d78b422
- 投稿日:2019-08-30T01:30:00+09:00
ゼロから作るDeepLearning作業ログ002
3章【ニューラルネットワーク 〜多次元配列と3層NN〜】
Introduction
前回はNNの簡単な定義と活性化関数について学習しました。
今回は機械学習について基本的な多次元配列についてさらっと復習して、3層NNを実装していきます。
多次元配列やその他数学的な内容については筆者が数学にバックグラウンドをもつため、簡単な復習やコメントのみに終始する可能性があることをここでお詫びしておきます。多次元配列の復習
多次元配列とは行列のことです。
和に関して線形であり多重線型性をもっているものです。
数学をある程度習った人ならテンソル⊗のことだと考えても良いと思います。それではnumpyを用いて1次元の配列から復習していきましょう。
import numpy as np
A = np.array([1,2,3,4])
print(A)
np.ndim(A)
A.shape
A.shape[0]
配列の次元については
np.ndim()関数で取得できます。
shapeはインスタンス変数であり、これはタプル型になっていることに注意しましょう。
このインスタンス変数を理解するには多次元配列について同様の操作をしてみるのがいいでしょう。B = np.array([[1,2],[3,4],[5,6]]) print(B) np.ndim(B) B.shapeこれは実行すると3×2型の行列になっていることがわかリます。
つまりshapeは与えられた多次元配列の(行列の)型を表すインスタンス変数です。また今後主に登場する多次元配列は単に行列であることが多いので、必要を迫られるまでは
shapeなどのインスタンス変数も単に行列の型のことを表していると考えます。また行列の積については
np.dot(A,B)で求めることができます。A = np.array([1,2,3,4]) B = np.array([[1,2],[3,4],[5,6],[7,8]]) np.dot(A,B) >>>array([50, 60])行列の積については特に(実装面だけでなく現実でもそうですが)型に注意してください。
次はいよいよ行列の積を用いて基本的な3層NNを実装していきましょう。
3層NNの実装
それでは行列の演算を用いて実装していきましょう。
行列が出てくるのはなぜかというと、計算の様子を簡単に表せるから以外の理由はありません。以下では下のような簡単なNNを実装していきます。
入力層、隠れ層2層、出力層をもつようなNNになっています。以下でこれから用いる記号を定義しておきます。
$w_{ij}^{(k)}$などの記号を導入し、これでk層目のi番目のノードからj番目のノードへの重みを表します。
$a_{i}^{j}$で j層目のi番目のノードの値を表します。これによるとm各信号のバイアスの和は以下の式で計算されます。
a_{i}^{j} = \sum w_{ij}^{(k)} + b_{i}^jつまり行列の積の形で表現すると第i層目の重み付きの信号の和というのは
A^{(i)} = XW^{(i)} + B^{(i)}と表現することができる。
これを具体的に実装してみよう。
まず1層目から2層目にかけての信号と重みとバイアスは以下のように実装されます。
今後もそうですが行列の型に関してだけは注意しましょう。import numpy as np def sigmoid(x): return 1/(1+np.exp(-x)) X = np.array([1.0,0.5]) #1層目の入力 W1 = np.array([[0.1,0.3,0.5],[0.2,0.4,0.6]]) #1層目の暫定の重み B1 = np.array([0.1,0.2,0.3]) #1層目のバイアス A1 = np.dot(X,W1) + B1 print(A1) Z1 = sigmoid(A1) print(Z1)活性化関数にはシグモイド関数を用いました。
次には第2層から3層にかけての実装を行いましょう。W2 = np.array([[0.1,0.4],[0.2,0.5],[0.3,0.6]]) #2層目の暫定の重み B2 = np.array([0.1,0.2]) #2層目のバイアス A2 = np.dot(Z1,W2) + B2 Z2 = sigmoid(A2) print(Z2)それでは最後に2層から出力層にかけての実装を行いましょう。
ここでは活性化関数というものは用いずに恒等写像で送り出します。W3 =np.array([[0.1,0.3],[0.2,0.4]]) B3 = np.array([0.1,0.2]) A3 = np.dot(Z2,W3) + B3 Y = A3 print(A3) #最終的な信号の出力最後に今までの実装をまとめましょう。今後習慣で重みなどは大文字で、バイアスは小文字で表すことにします。
以下のコードを眺めてみてください。import numpy as np def init_network(): #あくまで実装を簡潔に見せるための工夫。変数を初期化している。 network = {} #空のディクショナリを用意する。 network["W1"] = np.array([[0.1,0.3,0.5],[0.2,0.4,0.6]]) #1層目の暫定の重み network["b1"] = np.array([0.1,0.2,0.3]) #1層目のバイアス network["W2"] = np.array([[0.1,0.4],[0.2,0.5],[0.3,0.6]]) #2層目の暫定の重み network["b2"] = np.array([0.1,0.2]) #2層目のバイアス network["W3"] = np.array([[0.1,0.3],[0.2,0.4]]) network["b3"] = np.array([0.1,0.2]) return network def forward(network,x): #実質的なNNの働きをする関数。ここが今までの処理をまとめた部分になる。 W1,W2,W3 = network["W1"], network["W2"], network["W3"] b1,b2,b3 = network["b1"], network["b2"], network["b3"] a1 = np.dot(x,W1) + b1 z1 = sigmoid(a1) a2 = np.dot(a1,W2) + b2 z2 = sigmoid(a2) a3 = np.dot(z2,W3) + b3 y = a3 return y network = init_network() #初期化 x = np.array([1.0,0.5]) y = forward(network,x) print(y)おわり
次回は出力層の設計について書いていきます。
NNの図を作りたいのですが、何か良いツールをご存知の方いたら教えてください。
- 投稿日:2019-08-30T00:40:40+09:00
[Python] 競技プログラミングで再帰関数を書くときはsys.setrecursionlimitで最大再帰数を上げる
再帰数の上限がデフォルトで設定されていて、これを超えると例外が投げられる。
必要に応じて上げる。
>>> import sys
>>> sys.getrecursionlimit()  # 確認
1000
>>> sys.setrecursionlimit(10 ** 6)  # 変更
>>> sys.getrecursionlimit()  # 確認
1000000
https://docs.python.org/ja/3/library/sys.html#sys.setrecursionlimit
- 投稿日:2019-08-30T00:22:03+09:00
AtCoder Beginners Contest 過去問チャレンジ2
AtCoder Beginners Contest 過去問チャレンジ2
ABC129D - Lamp
特に難しいことはなくて、縦方向と横方向で別々に照らされる範囲のテーブルを作って、最後にそれぞれのテーブルの値の和 -1 (現在位置が2回カウントされる分を引く) の最大値を求めればいい. ただこういう配列を延々と嘗める処理は Python では絶望的に遅く TLE の嵐. まあ、PyPy で余裕の AC なんですが. それでも悔しくて Python で通すために最適化. 3回スキャンすると時間がかかるので、横方向だけテーブルを埋めて、縦方向をスキャンしてる時にオンザフライで最大値を求めていくようにしたらなんとか AC.
その後、他人の回答を見ていたら、配列の部分列に代入をする場合、スライスに同じ長さのリストを代入するのが速いと分かった. 毎回リストを生成する部分が重そうな気がしたが、その部分はC言語で書かれた機械語で行われるので Python で頑張るより速いというオチのようである.
yokoi[start:j] = [t] * tがそれを使っている部分である. この問題以外でこの知識を使うことはあるだろうかw.from sys import stdin def main(): from builtins import range readline = stdin.readline h, w = map(int, readline().split()) s = [readline().rstrip('\r\n') + '#' for _ in range(h)] s.append('#' * w) ft = [[i] * i for i in range(100)] yoko = [[0] * w for _ in range(h)] for i in range(h): start = -1 si = s[i] yokoi = yoko[i] for j in range(w + 1): if si[j] == '#': if start != -1: t = j - start if t < 100: yokoi[start:j] = ft[t] else: yokoi[start:j] = [t] * t start = -1 else: if start == -1: start = j result = 0 for i in range(w): start = -1 for j in range(h + 1): if s[j][i] == '#': if start != -1: t = yoko_max + j - start - 1 if t > result: result = t start = -1 else: yji = yoko[j][i] if start == -1: start = j yoko_max = yji else: if yji > yoko_max: yoko_max = yji print(result) main()ABC128D - equeue
K 回の操作の全組み合わせ. 入れたものを再度取り出してもしょうがないので、ガーッと左から連続的に取って、ガーッと連続的に右から取って、手持ちの一番低いほうから順に0未満を筒に詰める(左でも、右でもどっちでも良い、違いはない)といった感じである. 何も考えなくても TLE が出ないので、楽ちん.
n, k = map(int, input().split())
v = list(map(int, input().split()))
m = min(n, k)
result = 0
for i in range(m + 1):
  for j in range(i + 1):
    t = v[:j]
    t.extend(v[n - (i - j):])
    t.sort(reverse = True)
    l = k - i
    while len(t) > 0 and l > 0 and t[-1] < 0:
      t.pop()
      l -= 1
    result = max(result, sum(t))
print(result)
ABC127D - Integer Cards
真面目に書き換えるのはめんどくさいので、書き換え後の値を大きい方から順に並べて、その数を書き換え数分追加して、追加数が n を超えたら、ソートして、大きい方から n 個とればいいかなって.
n, m = map(int, input().split())
a = list(map(int, input().split()))
bc = [list(map(int, input().split())) for _ in range(m)]
bc.sort(key = lambda x: x[1], reverse = True)
t = 0
for b, c in bc:
  a.extend([c] * b)
  t += b
  if t > n:
    break
a.sort(reverse = True)
print(sum(a[:n]))
ABC084D - 2017-like Number
まず素数判定用のテーブルを作る. エラトステネスの篩.
その次に 2~105 までの累積和のテーブルを作る.
後は 2~r までの累積和から、2~l までの累積和を引けば答えが簡単に出る.from sys import stdin def main(): from math import sqrt readline = stdin.readline p = [True] * (10 ** 5 + 1) p[0] = False p[1] = False n = int(sqrt(10 ** 5)) + 1 for j in range(4, 10 ** 5 + 1, 2): p[j] = False for i in range(3, n + 1, 2): if p[i]: for j in range(i + i, 10 ** 5 + 1, i): p[j] = False c = [0] * (10 ** 5 + 2) for i in range(2, 10 ** 5 + 2): c[i] = c[i - 1] if p[i - 2] and p[(i - 1) // 2]: c[i] += 1 q = int(readline()) for _ in range(q): l, r = map(int, readline().split()) print(c[r + 2] - c[l + 1]) main()ABC054D - Mixing Experiment
DP で総当りするだけです(終). といいつつ、時系列無しテーブルで解いたので、これは本当に DP なのか? その回のものを2回使わないようにループを降順に回します.
INF = float('inf')
n, ma, mb = map(int, input().split())
cmax = n * 10
t = [[INF] * (cmax + 1) for _ in range(cmax + 1)]
for _ in range(n):
  a, b, c = map(int, input().split())
  for aa in range(cmax, 0, -1):
    for bb in range(cmax, 0, -1):
      if t[aa][bb] == INF:
        continue
      t[aa + a][bb + b] = min(t[aa + a][bb + b], t[aa][bb] + c)
  t[a][b] = min(t[a][b], c)
result = INF
for a in range(1, cmax):
  for b in range(1, cmax):
    if a * mb == b * ma:
      result = min(result, t[a][b])
if result == INF:
  result = -1
print(result)
ABC049D - 連結 / Connectivity
道路の連結を計算し、鉄道の連結を計算し、都市 i の道路グループID、鉄道グループIDの2要素のタプルを列挙して集計して、集計結果を都市ごとに出力すれば OK. 出題者の想定通りに Union Find を使えば、根のノード番号がグループ ID になり、簡単かつ高速に解ける. 自分は 素集合データ構造 を見ながら Union Find を書きました. path compression(経路圧縮)は入れないと速度的にむりーだが、こんな軽くて簡単なものを入れないやつの頭はおかしい.
from sys import stdin

def main():
  def find(parent, i):
    t = parent[i]
    if t == -1:
      return i
    t = find(parent, t)
    parent[i] = t
    return t

  def unite(parent, i, j):
    i = find(parent, i)
    j = find(parent, j)
    if i == j:
      return
    parent[i] = j

  from builtins import int, map, range
  readline = stdin.readline

  n, k, l = map(int, readline().split())

  roads = [-1] * n
  rails = [-1] * n

  for i in range(k):
    p, q = map(int, readline().split())
    unite(roads, p - 1, q - 1)

  for i in range(l):
    p, q = map(int, readline().split())
    unite(rails, p - 1, q - 1)

  d = {}
  for i in range(n):
    t = (find(roads, i), find(rails, i))
    if t in d:
      d[t] += 1
    else:
      d[t] = 1

  print(*[d[(find(roads, i), find(rails, i))] for i in range(n)])

main()
と書いているが、この問題を解く前は Union Find なぞ知らなかったので、普通の探索で最初は書いてて TLE を出しまくったのだ. Union Find 版で AC をゲットした後も未練たらしく探索版を修正していたらなんか AC がゲットできてしまったw. よって、この問題においては Union Find は必須ではない.
from sys import stdin

def create_links(n, k):
  links = [[] for _ in range(n)]
  for i in range(k):
    p, q = map(int, stdin.readline().split())
    links[p - 1].append(q - 1)
    links[q - 1].append(p - 1)
  return links

def create_groups(n, links):
  groups = list(range(n))
  for i in range(n):
    if groups[i] != i:
      continue
    q = [i]
    while q:
      j = q.pop()
      for k in links[j]:
        if groups[k] != i:
          groups[k] = i
          q.append(k)
  return groups

n, k, l = map(int, input().split())
road_links = create_links(n, k)
rail_links = create_links(n, l)
road_groups = create_groups(n, road_links)
rail_groups = create_groups(n, rail_links)

d = {}
for i in range(n):
  t = (road_groups[i], rail_groups[i])
  if t in d:
    d[t] += 1
  else:
    d[t] = 1

print(*[d[(road_groups[i], rail_groups[i])] for i in range(n)])


